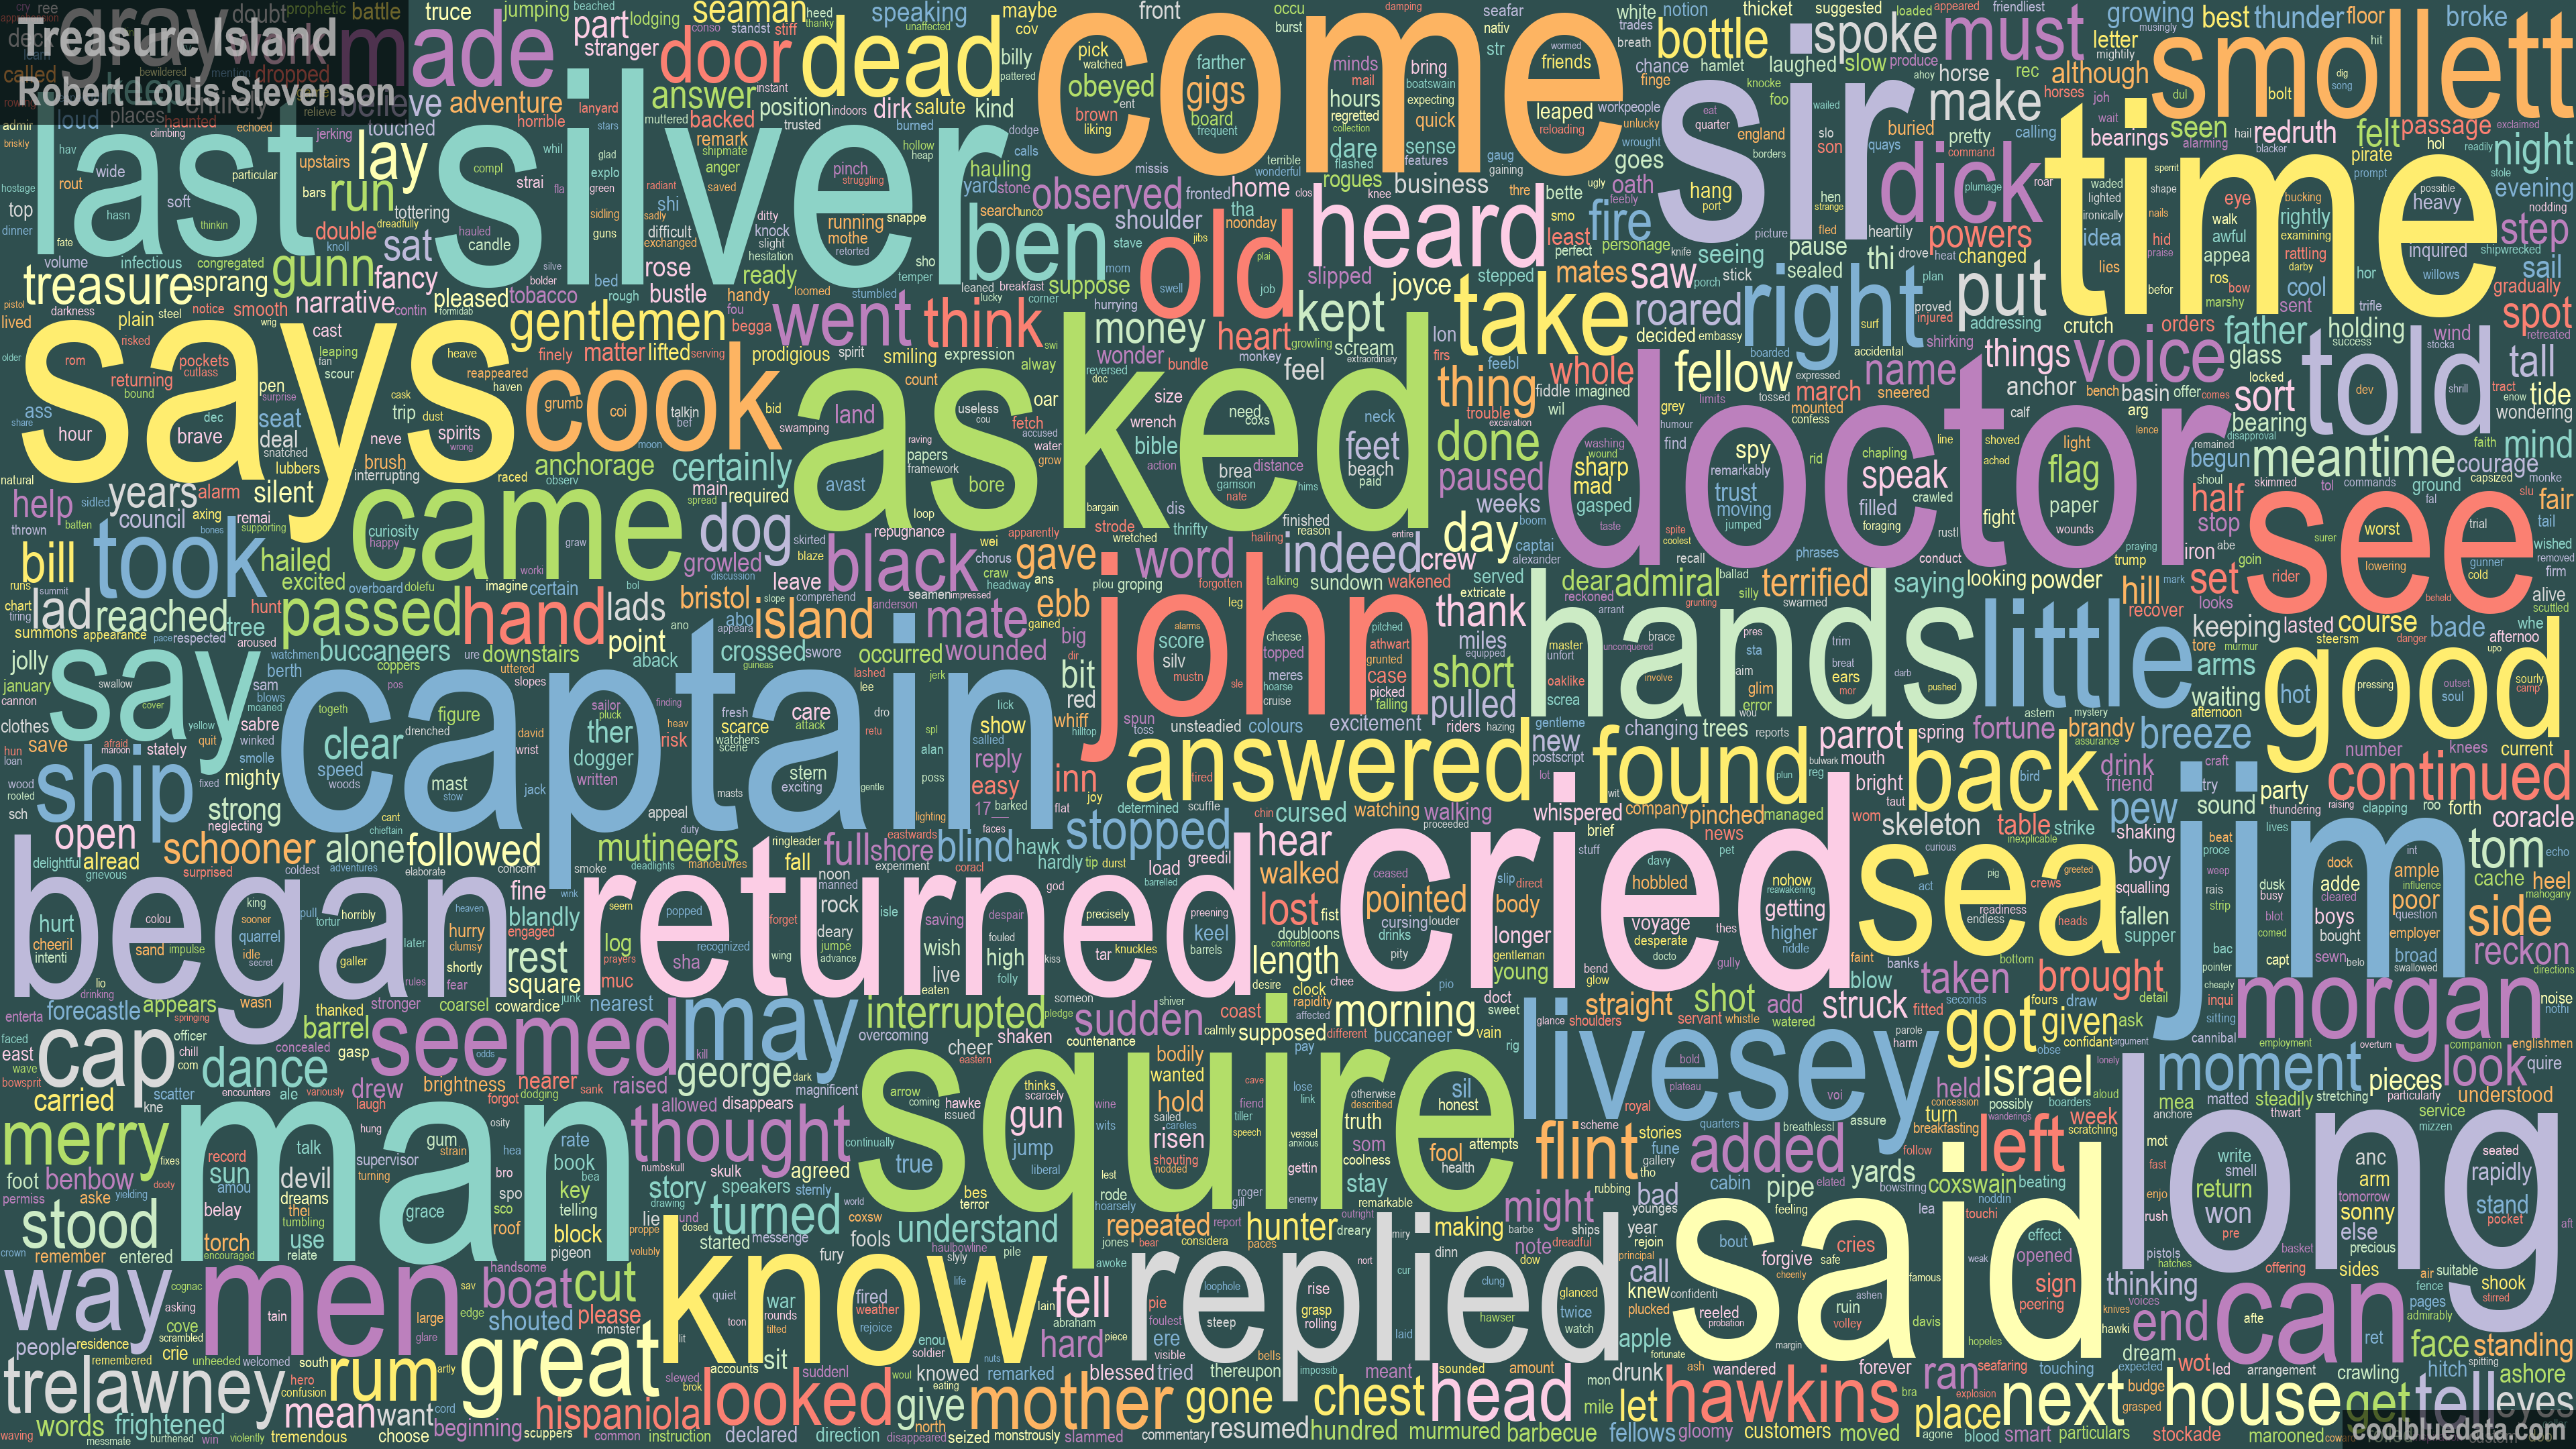
A Word Cloud is a visualization that contains words from a set of data, with the font size directly proportional to the frequency of the word in the set. See below an example of a word cloud based on the words of the novel ‘Treasure Island‘ by Robert Louis Stevenson. Here you can highlight the most common words in the novel – they are presented in a larger font:
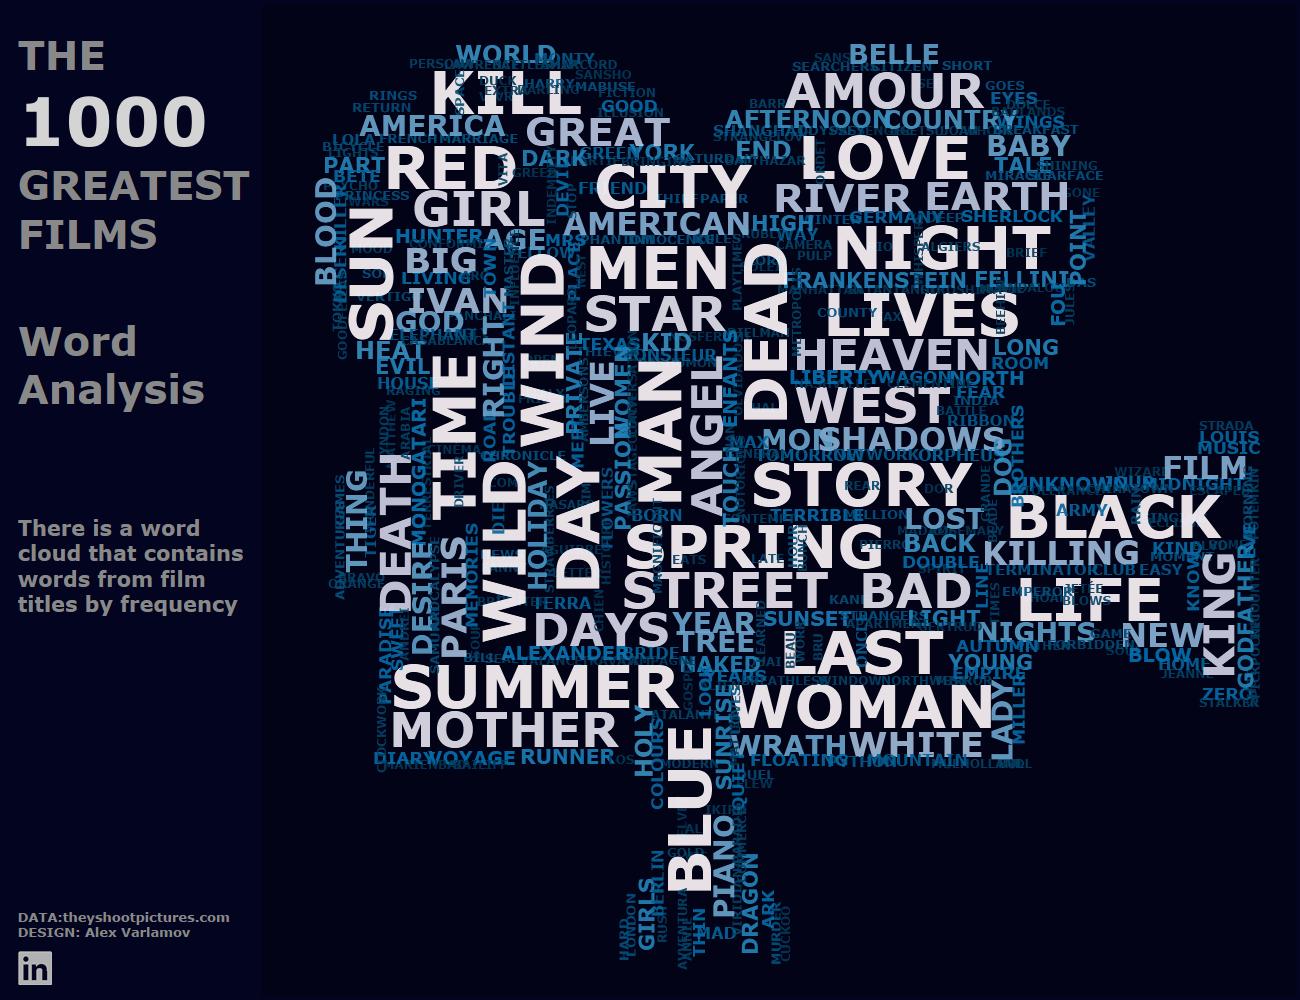
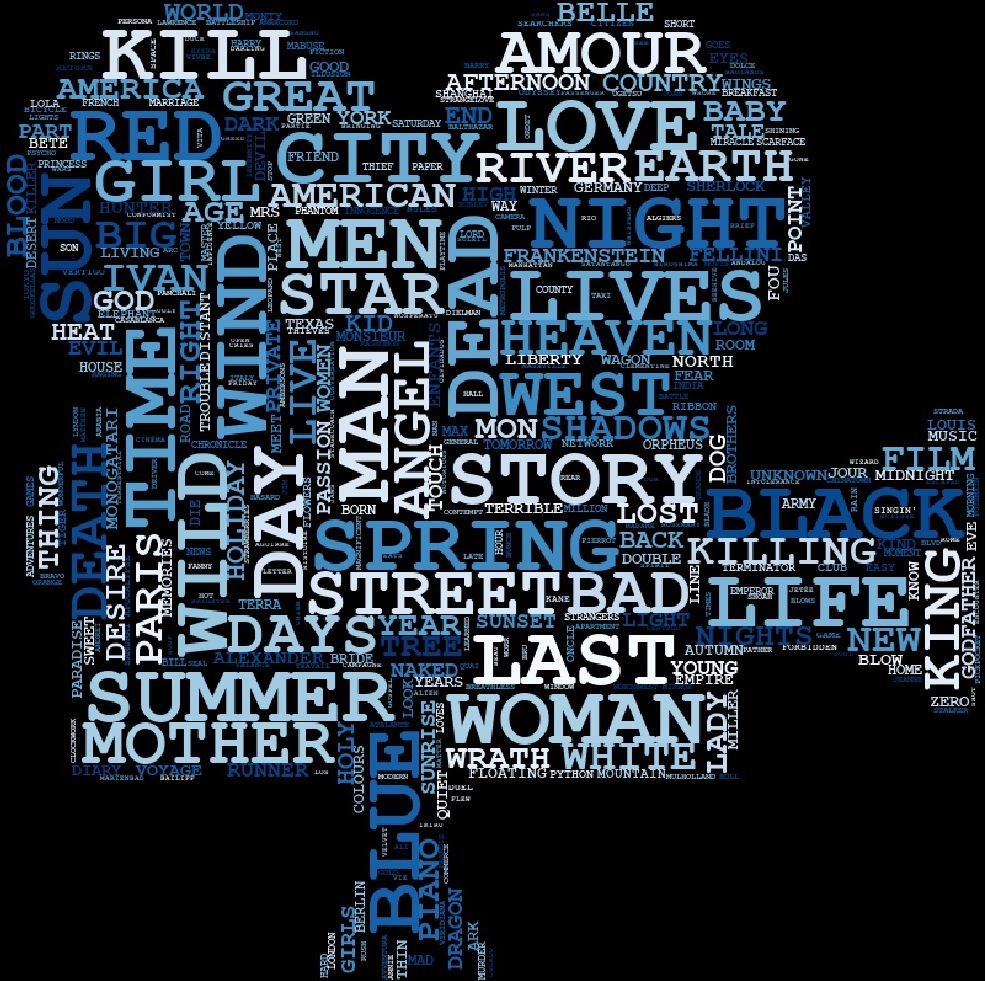
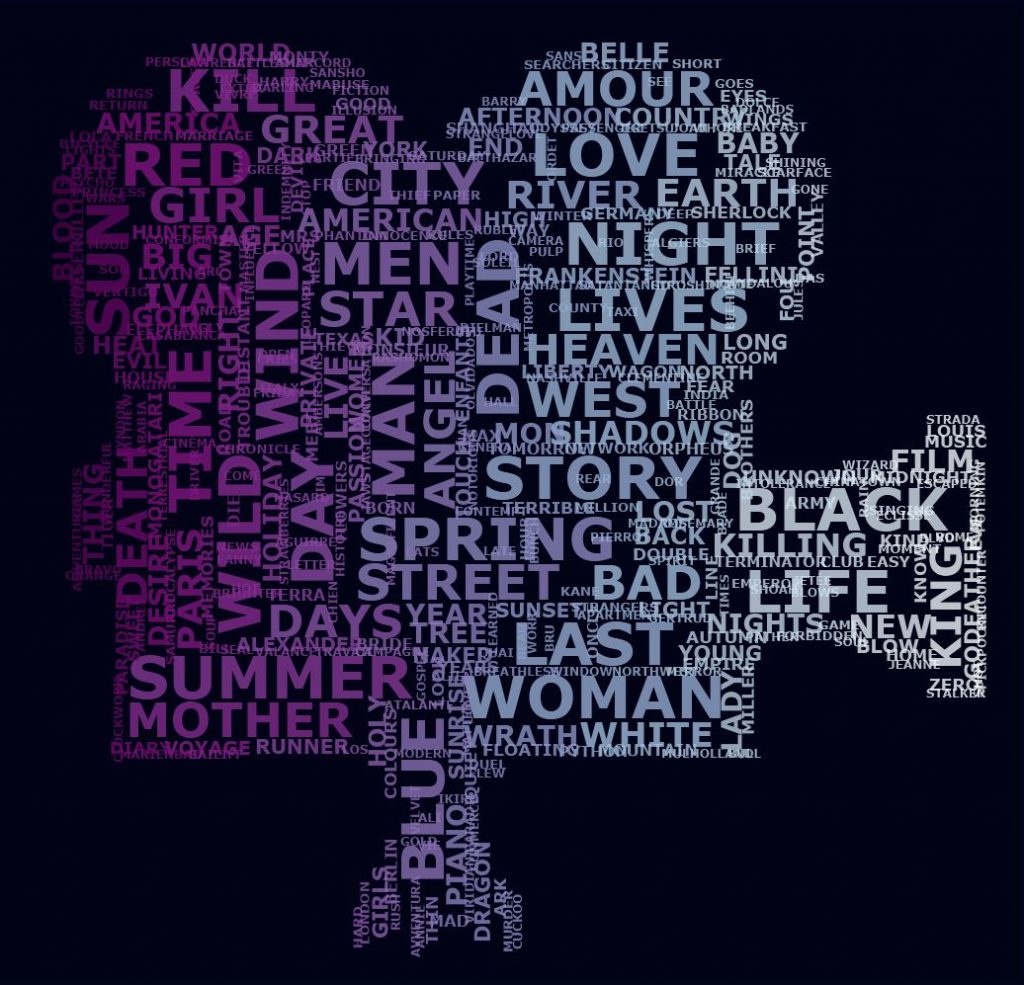
This word cloud was created using Python code, and we will consider this code and how it works in the article. In total, I made 25 such visualizations of the most famous books. They can be found on this web site in the ‘Books‘ project. In addition, in this article, we will look at how to create custom word clouds in Tableau, having previously calculated the coordinates of the words in Python. Find below an example of such visualization in Tableau that presents words from the titles of the greatest films by their frequency:
You can read more about Word Clouds in Python in the articles:
1. Data Preparing
Python has a ‘WordCloud‘ library that lets you create custom word clouds. Examples of such visualizations and Python code are in the documentation for this library. To work with this library, you need to prepare the data. ‘The Top 1000 Greatest Movies’ dataset I got from theyshootpictures.com. A simple copy to Excel and a little bit of column splitting work is enough to make the data look like this:

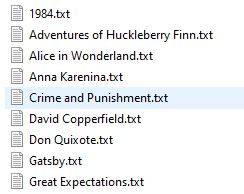
The code below will only parse the names in English locared in the Film column. The rest of the columns can be used as additional information in the final visualization. This file was saved as 1000 Top Films.csv. For the analysis of literary works in the ‘Books‘ project I used ordinary text files with book texts. The literary works themselves are available on the open source gutenberg.org. That is, we got a list of text files:
2. Word Clouds in Python
The code below creates words from the titles of ‘the Top 1000 of the greatest films’.
import pandas as pd
import numpy as np
import matplotlib.pylab as plt
from PIL import Image
from stop_words import get_stop_words
from nltk.corpus import stopwords
import time
from wordcloud import WordCloud, STOPWORDS, ImageColorGenerator, get_single_color_func

#read text
data2 = pd.read_csv ('C:/Docs/Tableau/Projects/Word Cloud/1000 Best Films/1000 Top Films.csv', usecols = ['Film'], sep = ',', encoding="ISO-8859-1")

start_time = time.time()

#read stoplist
stoplist = pd.read_csv ('C:/Docs/Tableau/Projects/Word Cloud/Books/Stop List.csv',  usecols = ['Word'], sep = ',', encoding="utf-8")

print(data2)
print(stoplist)

df =pd.DataFrame (stoplist, columns=["Word"])
stop_list = df["Word"].tolist()

a1 =pd.DataFrame (data2)
a3 = pd.DataFrame.to_string(a1)
a0 = a3.upper()

stop = get_stop_words('en')
print (stop)
stop.extend(stop_list)
stop.extend(["thou", "thy", "thee", "dost", "les"])
stopwords = set(stop)

print(stopwords)

building = np.array(Image.open('C:/Docs/Tableau/Projects/Word Cloud/1000 Best Films/Video.jpg'))
wordcloud = WordCloud(max_words=50000,
                      stopwords = stopwords,
                      font_path='C:/Windows/Fonts/courbd.ttf',
                      prefer_horizontal=.7,
                      colormap='Blues',
                      min_font_size=5,
                      max_font_size=70,
                      background_color="Black",
                      width=7680,
                      height=4320,
                      margin=2,
                      collocations=False,
                      mask=building,
                      repeat=False,
                      relative_scaling=0,
                      scale=1,
                      min_word_length=3,
                      include_numbers = False,
                      normalize_plurals = False,
                      font_step=1).generate(a0)

print (wordcloud.layout_)

df = pd.DataFrame(wordcloud.layout_, columns = ['Name', 'Size', 'Coord', 'Direction','Color'])
df.to_csv('C:/Docs/Tableau/Projects/Word Cloud/1000 Best Films/Films_Coordinates.csv')

print(' ')
print ("time elapsed: {:.2f}s".format(time.time() - start_time))

plt.figure(figsize=(30,30))
plt.imshow(wordcloud)
plt.axis("off")
plt.tight_layout(pad=0)
plt.show()
This code reads text from the 1000 Top Films.csv file and also reads a stop list from another .csv file. The stop list contains words that will be removed from the original text. You can also use stop lists from libraries like stop_words or nltk:
from stop_words import get_stop_words
from nltk.corpus import stopwords
In addition, the code has the ability to enter stop words, this is implemented in the line that adds words to the list of stop words:
stop.extend(["thou", "thy", "thee", "dost", "les"])
The next line reads the mask file:

building = np.array(Image.open('C:/Docs/Tableau/Projects/Word Cloud/1000 Best Films/Video.jpg'))
As a result of executing the code, the following word cloud is obtained:
The following are the word cloud parameters that are used in the code:
| max_words=50000 | maximum word number in the word cloud = 50000 |
| font_path=’C:/Windows/Fonts/courbd.ttf’ | path to font file you wish to use (default: DroidSansMono) |
| prefer_horizontal=.7 | ratio of times to try horizontal fitting as opposed to vertical |
| colormap=’Blues | matplotlib colormap name |
| min_font_size=5 |
smallest font size to use (Default: 4) |
| max_font_size=70 | maximum font size for the largest word |
| background_color=”Black” | Background color |
| width=7680, height=4320, | image resolution |
| margin=2 | spacing to leave around words |
| collocations=False | do not add collocations (bigrams) to word cloud |
| mask=building | mask to use for the image form |
| repeat=False | whether to repeat words and phrases |
| relative_scaling=0 | scaling of words by frequency (0 – 1) |
| scale=1 | scaling between computation and drawing |
| min_word_length=3 | only include words with more than X letters |
| include_numbers = False | include numbers in wordcloud? |
| normalize_plurals = False | whether to remove trailing ‘s’ from words |
| font_step=1 | step size for the font |
These are not all options that can be used. All parameters and their description can be found in the library description WordCloud.
Note: the wordcloud library does not work correctly with all fonts, so first it is better to check on a small amount of data how your chosen font is displayed
The following lines in the code are needed to calculate the execution time of the code and display the time on the screen, they do not affect the rendering itself:
import time

start_time = time.time()

print ("time elapsed: {:.2f}s".format(time.time() - start_time))
Also, after executing the code, a Film_Coordinates.csv file will be generated, which will list the X and Y coordinate pairs for each word. This file is only needed to transfer the word cloud to Tableau.
All letters are converted to upper case in the string:
a0 = a3.upper()
This is necessary so that words with a capital letter at the beginning and in the middle of sentences do not differ.
3. Stop Words
Stop words are words that we don’t want to see in the word cloud, so we discard them.
The code uses the stop_words library, in which the list of stop words in English looks like this:
['a', 'about', 'above', 'after', 'again', 'against', 'all', 'am', 'an', 'and', 'any', 'are', "aren't", 'as', 'at', 'be', 'because', 'been', 'before', 'being', 'below', 'between', 'both', 'but', 'by', "can't", 'cannot', 'could', "couldn't", 'did', "didn't", 'do', 'does', "doesn't", 'doing', "don't", 'down', 'during', 'each', 'few', 'for', 'from', 'further', 'had', "hadn't", 'has', "hasn't", 'have', "haven't", 'having', 'he', "he'd", "he'll", "he's", 'her', 'here', "here's", 'hers', 'herself', 'him', 'himself', 'his', 'how', "how's", 'i', "i'd", "i'll", "i'm", "i've", 'if', 'in', 'into', 'is', "isn't", 'it', "it's", 'its', 'itself', "let's", 'me', 'more', 'most', "mustn't", 'my', 'myself', 'no', 'nor', 'not', 'of', 'off', 'on', 'once', 'only', 'or', 'other', 'ought', 'our', 'ours', 'ourselves', 'out', 'over', 'own', 'same', "shan't", 'she', "she'd", "she'll", "she's", 'should', "shouldn't", 'so', 'some', 'such', 'than', 'that', "that's", 'the', 'their', 'theirs', 'them', 'themselves', 'then', 'there', "there's", 'these', 'they', "they'd", "they'll", "they're", "they've", 'this', 'those', 'through', 'to', 'too', 'under', 'until', 'up', 'very', 'was', "wasn't", 'we', "we'd", "we'll", "we're", "we've", 'were', "weren't", 'what', "what's", 'when', "when's", 'where', "where's", 'which', 'while', 'who', "who's", 'whom', 'why', "why's", 'with', "won't", 'would', "wouldn't", 'you', "you'd", "you'll", "you're", "you've", 'your', 'yours', 'yourself', 'yourselves']
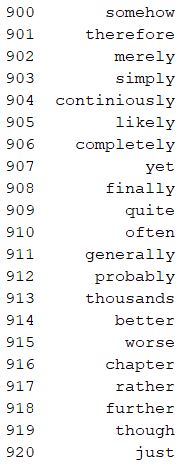
When analyzing the texts of books, this list was not enough for me, so I created a separate Stop List.csv file with adverbs, numbers, pronouns, interjections, numbers, prepositions, obsolete and obscene words. There are more than 1000 words in the list, a part of the list looks like this:
Please note that I added the word ‘Chapter’ to the stop list, because for books with small chapters this word was very frequent, but it does not affect the plot of the books.
In addition, for each source of text, specific words may be found, for example, in Shakespeare’s works. They can be removed right in the code by adding to the list:
stop.extend(["thou", "thy", "thee", "dost", "thus", "going",
             "doth", "many", "much", "nay", "aye", "don", "isn", "ain",
              "didn", "tis", "vii", "viii", "les"])
Thus, as a source of stop words, you can use:
- Libraries
- Files
- a List inside your code
Also, all these lists can be combined.
Thus, we get rid of frequent words: prepositions, adverbs, pronouns, etc., which do not characterize the plot of the book or the meaning of another source of the text.
4. Word Clouds in Tableau
The common cloud in Tableau looks like this:
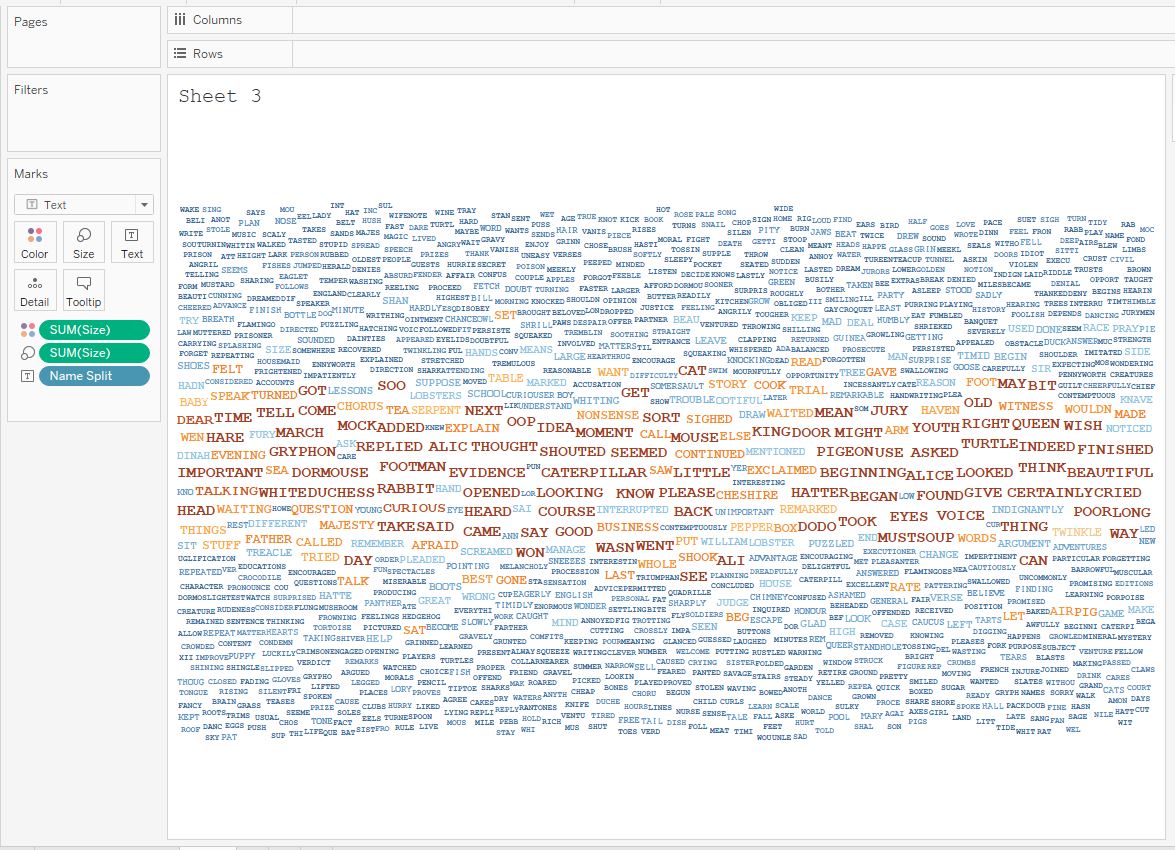
This word cloud is built on the frequency of words in the book “Alice in Wonderland”. To create it, you need a dataset with each word and the frequency of its repetition in the book. Tableau itself cannot create such a dataset from the text of the book, so third-party tools are used, for example, Python.
This type of visualization is suitable for small amounts of text data. In addition, this word cloud has significant limitations:
- The maximum text size is limited
- Words can be placed either horizontally or vertically
- Cloud shape cannot be selected
In Python, there are no such restrictions. In addition, there are many advanced settings. Tableau provides additional interactive features (filtering, actions). Therefore, you can calculate the coordinates of words in Python and then transfer them from to Tableau to create a custom word cloud.
The WordCloud library allows you to pick up the coordinates of words, the color and direction of the text. The wordcloud.layout_ method does this in the lines:
df = pd.DataFrame(wordcloud.layout_, columns = ['Name', 'Size', 'Coord', 'Direction','Color'])
df.to_csv('C:/Docs/Tableau/Projects/Word Cloud/1000 Best Films/Films_Coordinates.csv')
The Film_Coordinates.csv file looks like this:
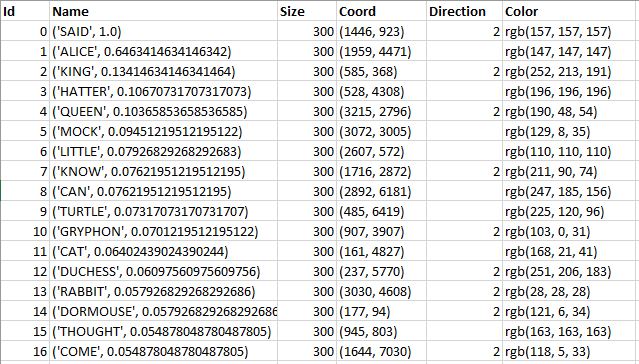
It can either be finalized in Python (separate X and Y, convert colors to hexadecimal format, etc.), or tyou can ransfer the calculations to Tableau. Let’s go the second way and first split the Name field and the coordinates using SPLIT:
Name
TRIM( SPLIT( SPLIT( [Name], “(“, 2 ), “‘”, 2 ) )
X
INT(TRIM( SPLIT( SPLIT( SPLIT( [Coord], “(“, 2 ), “,”, 2 ), “)”, 1 ) ))
Y
INT(TRIM( SPLIT( SPLIT( [Coord], “(“, 2 ), “,”, 1 ) ))
The calculations above look quite cumbersome, but they are easy to figure out. If you are familiar with regular expressions, then you can use them. For example, for Y, a similar calculation looks like this:
INT(REGEXP_EXTRACT_NTH([Coord], ‘(\d+)’, 1))
Thanks to Artem Prytkov for his advice on regular expressions.
If you want to know more about how to work with text in Tableau using regular expressions, you can read the following articles:
- ‘An Introduction To Tableau Regular Expressions (REGEX)’ by Ken Flerlage
- ‘Detailed Guide to Regular Expressions‘ by Rajeev Pandey
After that, we will plot the origin points on a scatter plot using the image of the word cloud obtained in Python as a background:
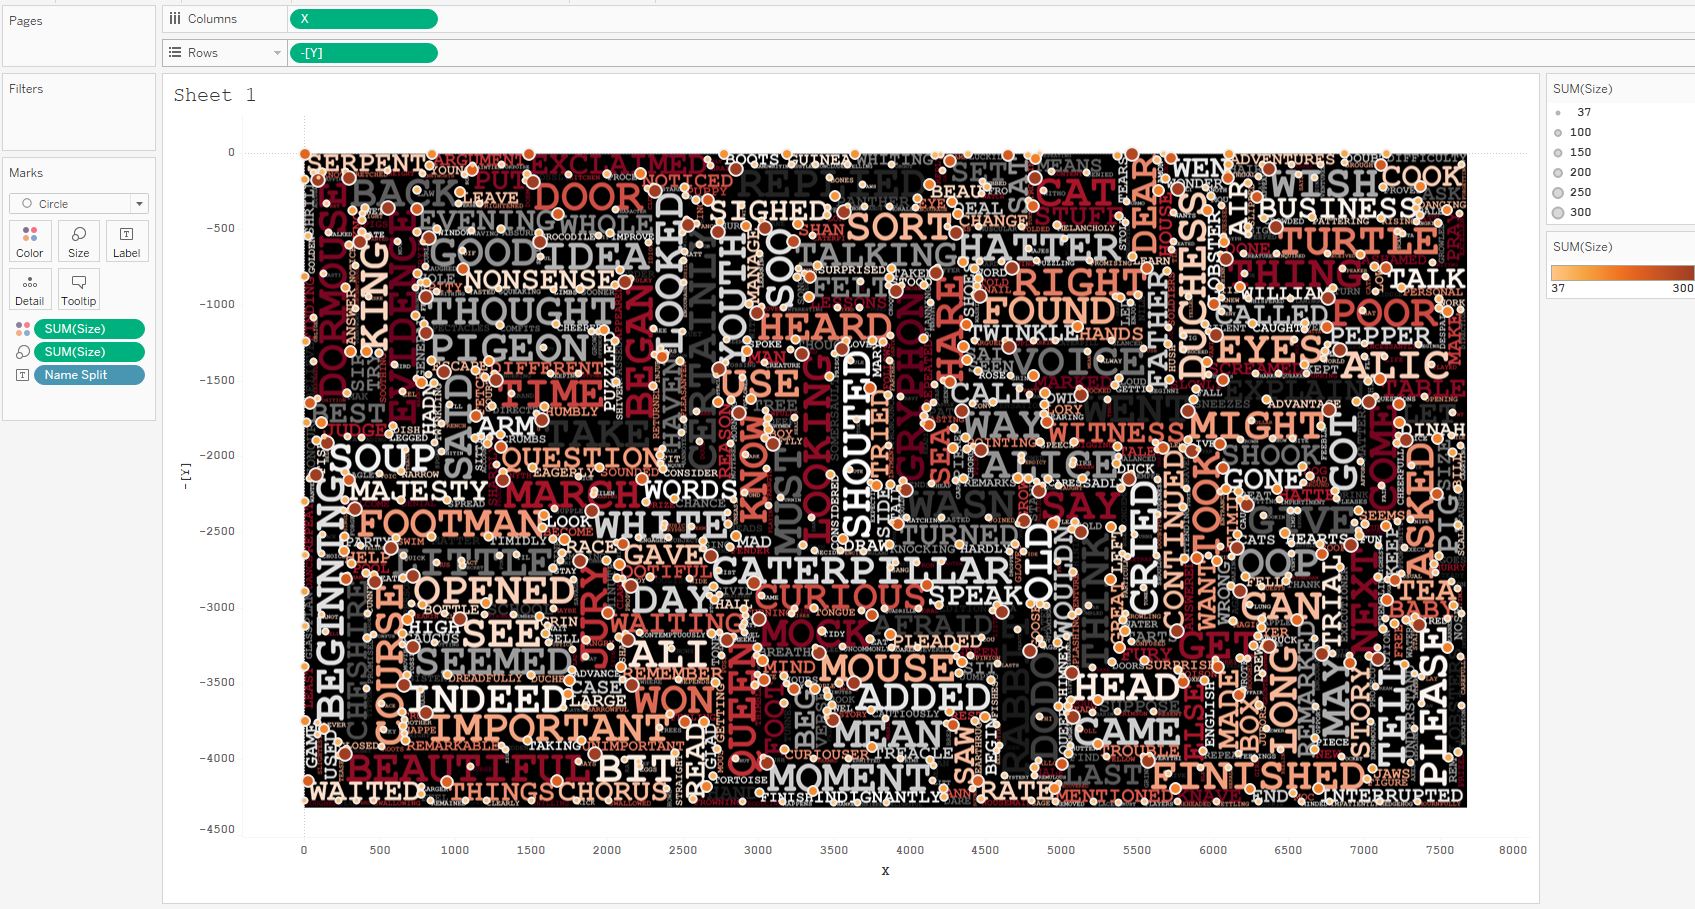
You can see that Python passed in the coordinates of the upper left corners of each word. Tableau works with word centers (centroids). That is, if we represent each word as a rectangle, we have the coordinates of the upper left corners, and we need the geometric coordinates of the centers of these rectangles. Therefore, we need to calculate the coordinates of the centers.
In addition, there are two directions of words in our data: horizontal and vertical. They are set in the Direction field. A value of 2 is the vertical direction, an empty cell is the horizontal direction. In Tableau we will use the Dual Axis option where we will show only horizontal names on one axis, and only vertical ones on the other one.
Calculations for the coordinates of the centers of rectangles (words) are:
X Shift
IF ISNULL([Direction]) THEN
[X]+ [Parameter 1]*[Size]/2* LEN([Name Split])
ELSE [X]+ [Parameter 1]*[Size]/2
END
Y Shift Horizontal
IF ISNULL([Direction]) THEN
–[Y]– [Parameter 1]*[Size]/2
END
Y Shift Vertical
IF ISNULL([Direction])=False THEN
–[Y]– [Parameter 1]*[Size]/2* LEN([Name Split])
END
These calculations are based on dividing the length and height of words in half so that the coordinates are shifted from the corners to the centers of the words.
Note: the visualization uses a monospaced Courier New font with the same width for all letters. So the centers of the rectangles are more precisely located in Tableau.
The Parameter 1 is needed here for fitting words. This is due to the fact that at different screen resolutions Tableau does not change the font size, so you have to adjust the font size in the Marks shelf to Size. The parameter can additionally minimize the gaps between words.
The Size field in the dataset is the font size, and Tableau uses the area of the rectangle that the word is in, so a square appears in Size:
([Size]/2)^2
As a result, you get the following visualization with two axes:
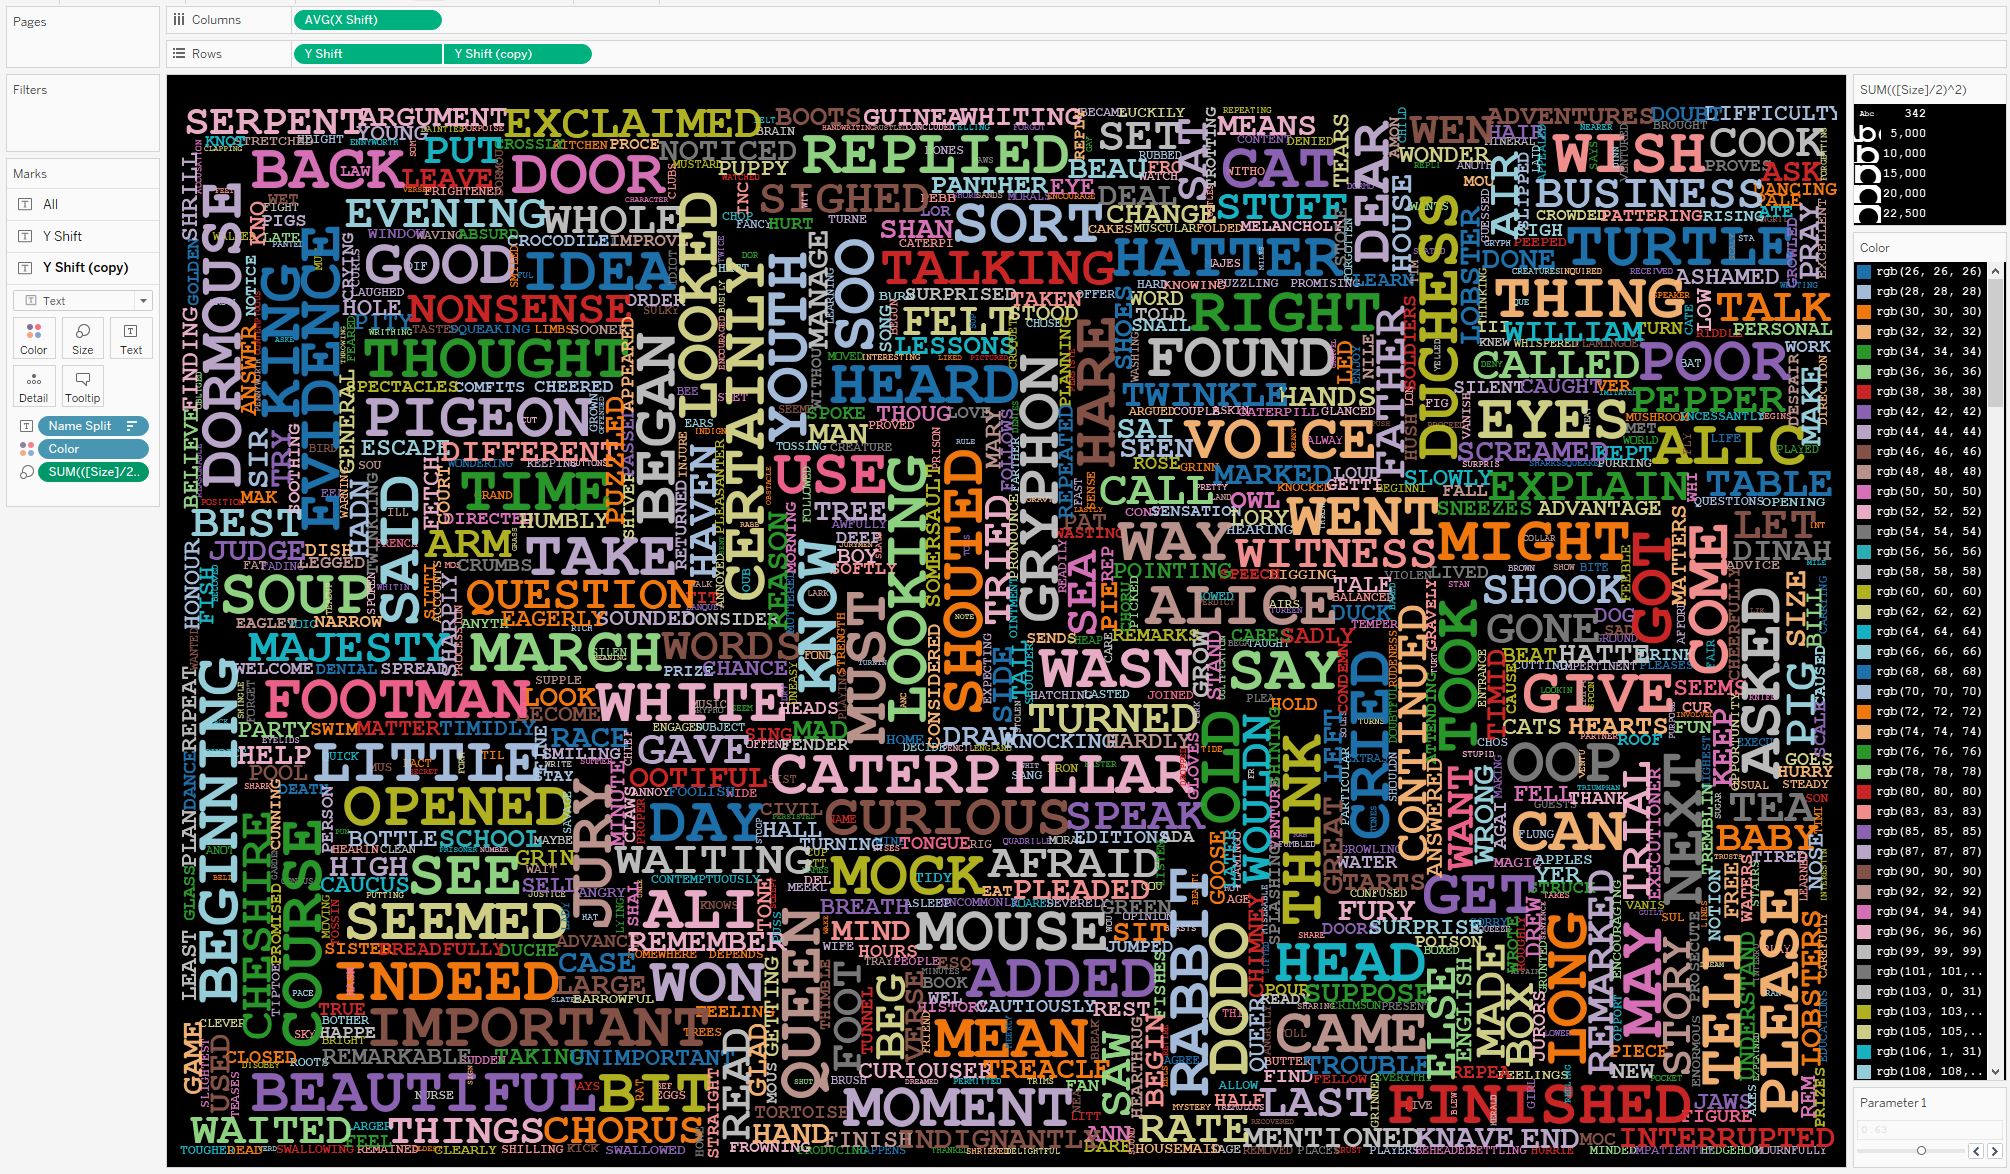
On the vertical word axis, you can select the direction from bottom to top or top to bottom in the text direction settings.
You also need to set up the same grid steps along X and Y axes. So we will get the final viz:
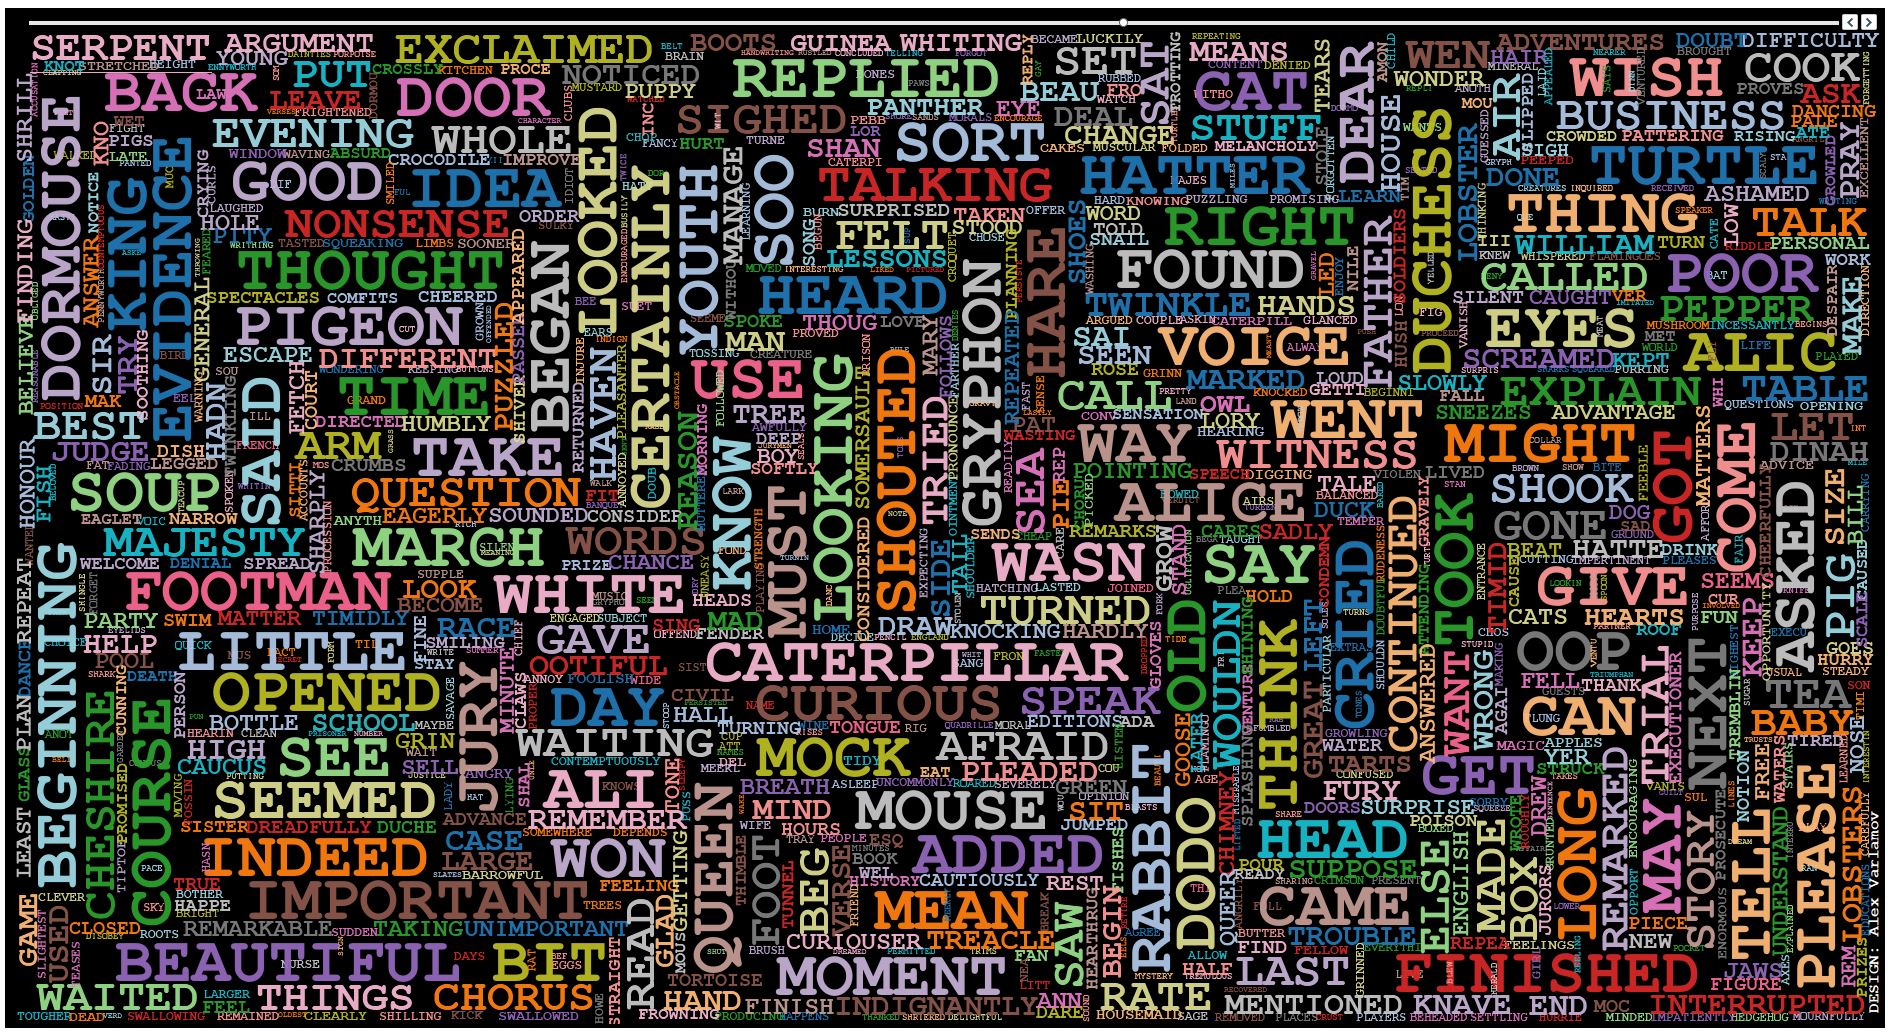
Tableau has restrictions on the height of the text, so text in the word cloud cannot be made larger or smaller than certain boundaries. There are no such restrictions in Python. Therefore, in Tableau, sometimes words overlap other words a little, and such a perfect picture as in Python does not work in Tableau.
In Color, you can add various calculations, for example, if you add X Shift, then for films we get the following picture:
Conclusion
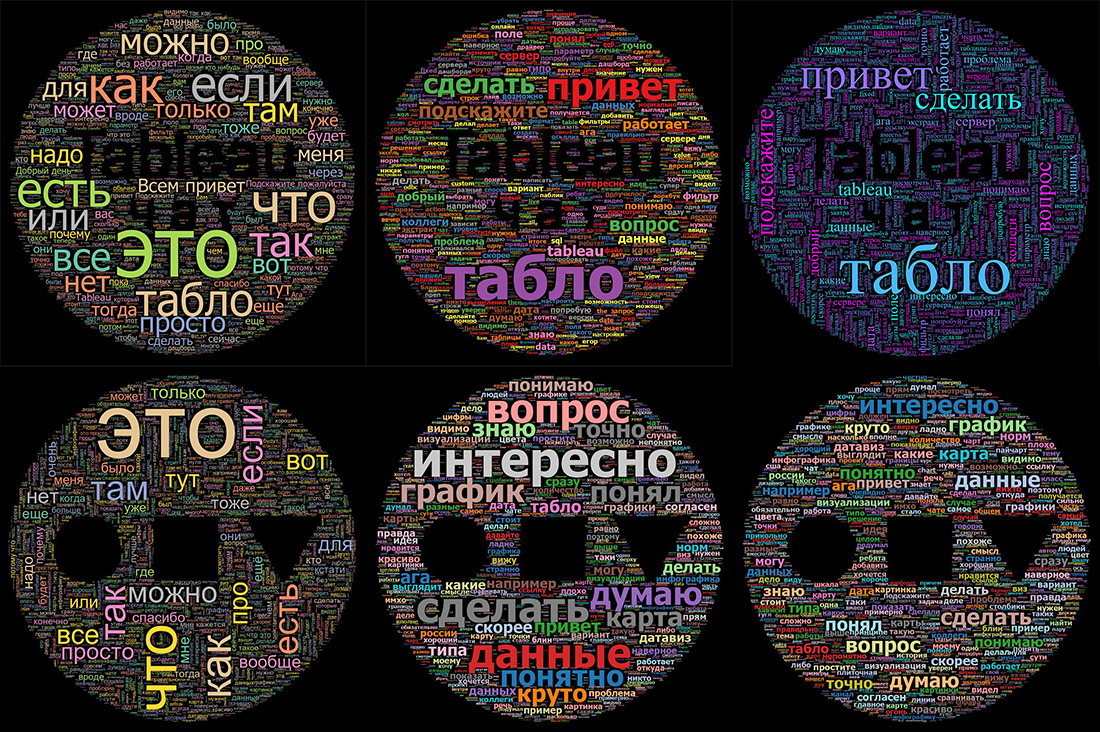
Word cloud is a visualization that is not used in business tasks, but it can be found in infographics.
Quite interesting, such word clouds look like a logo. Below are examples of visualizations where messages in Russian-language Telegram Tableau chats (first line) and infographics (second line) were analyzed. The first column shows word clouds without stop words, the second and third one are clouds without of stop words.