
The Mapbox tools are amazing things that can empower spacious data analysis and visual analytics. Tableau and PowerBI are efficient analytics software for complex analytics challenges and astounding data visualizations. Connecting monsters in geomapping and BI we can create powerful tools for the spacious analysis.
In the blog post I am going to tell you about Mapbox GL interactive maps and tools that help to make superb visualizations in BI systems.
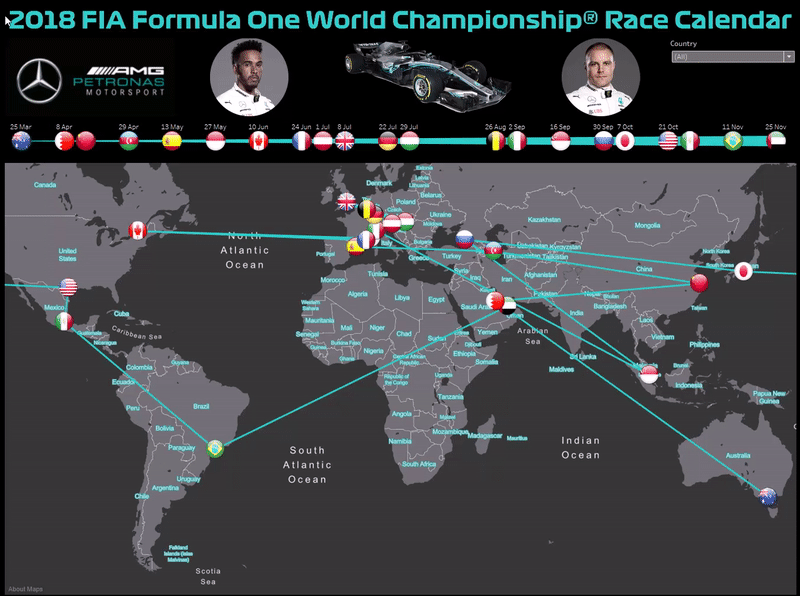
Find below the two different visualizations in Tableau and Power BI on the topic of Formula 1 2018 with my favorite team Mercedes-AMG Petronas Motorsport.
TABLEAU
POWER BI
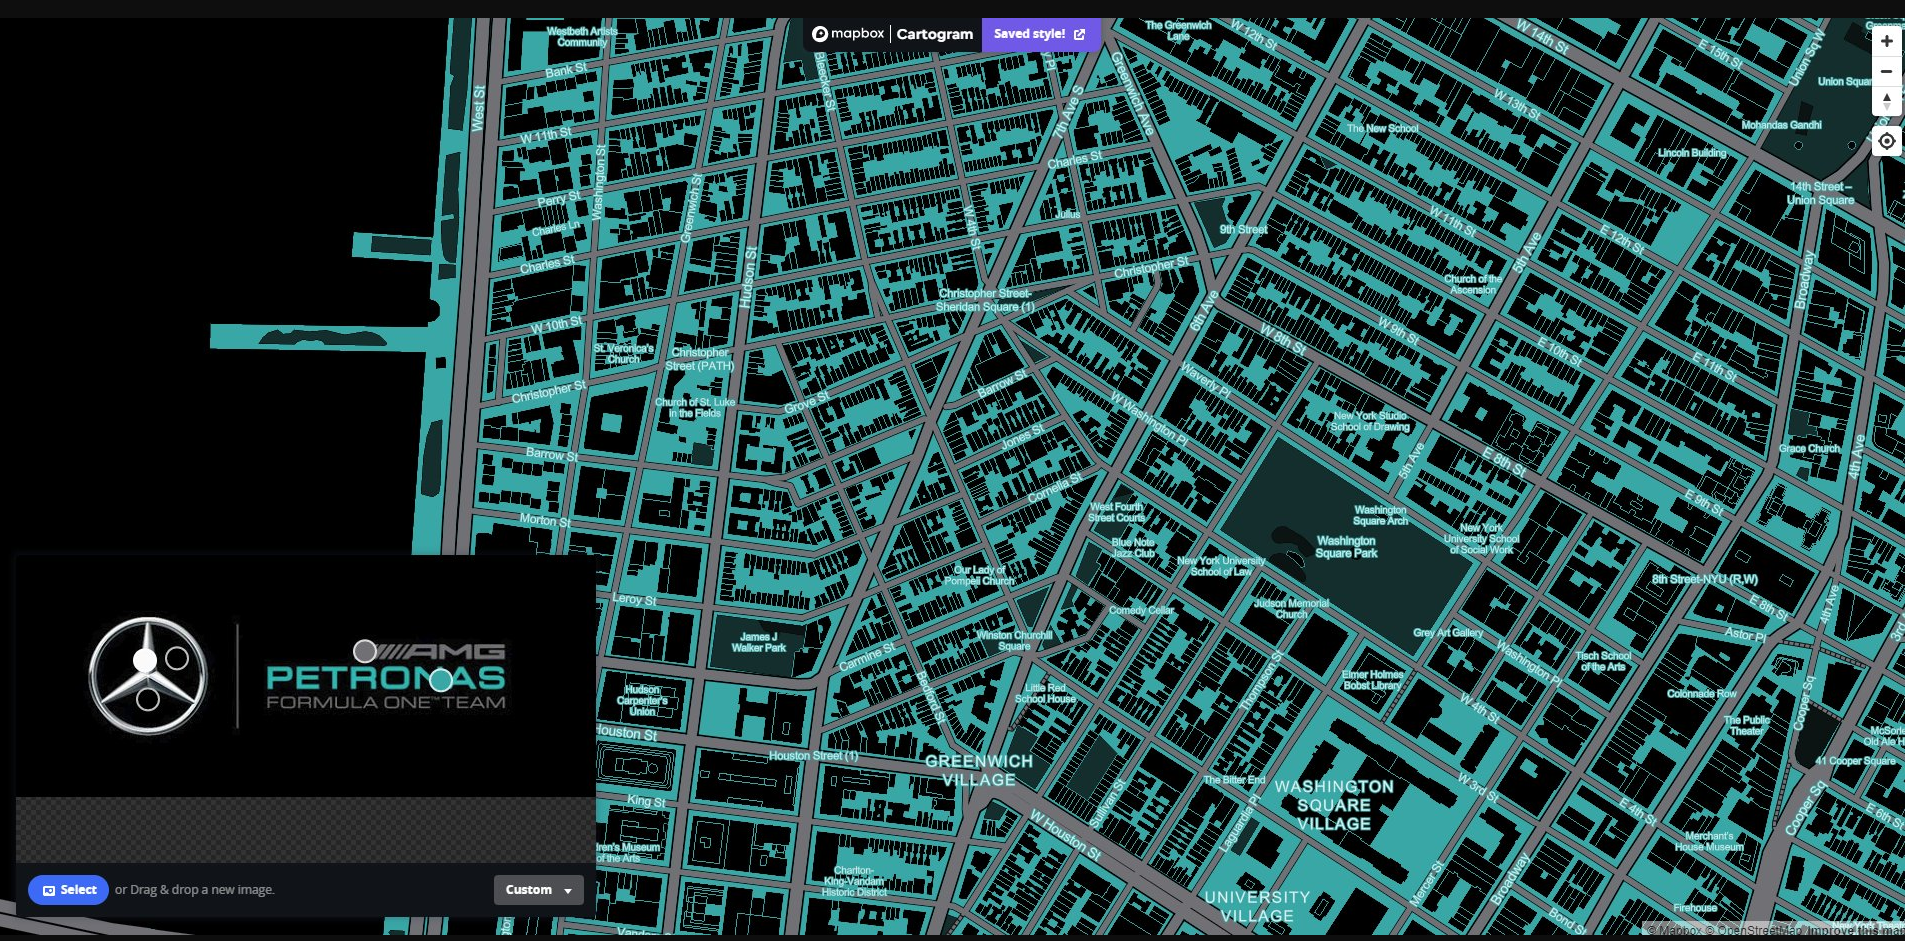
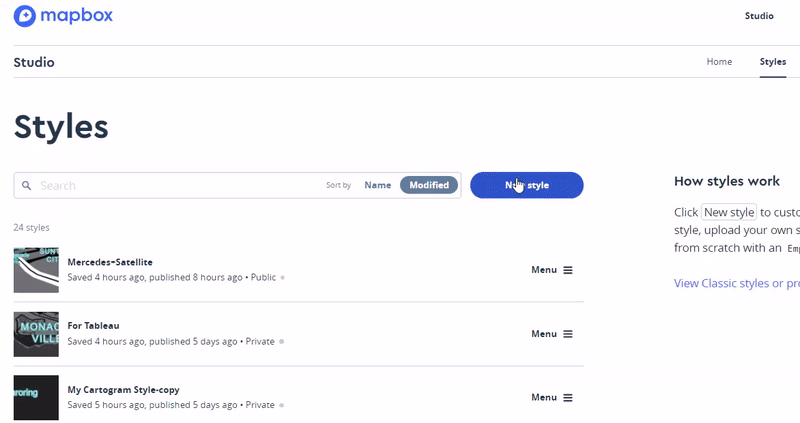
1. Mapbox. Using Cartogram Tool
The Tableau has only a couple of embedded maps and there is no map styles changing Mapbox’ cartogram is a drag-and-drop design tool to create a custom map.
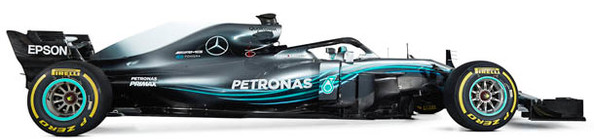
I really like Formula 1 and Mercedes AMG Team. I have made a custom map using the cartogram tools and my favorite team colors. You need only open the tool and load a picture choosing map colors. That’s a piece of cake!
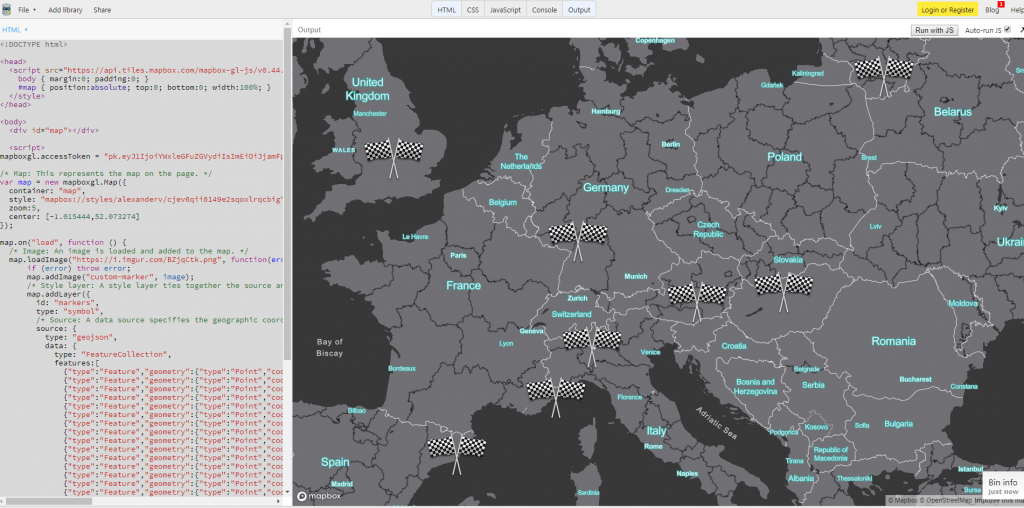
2. Mapbox. Adding Points to the custom Map
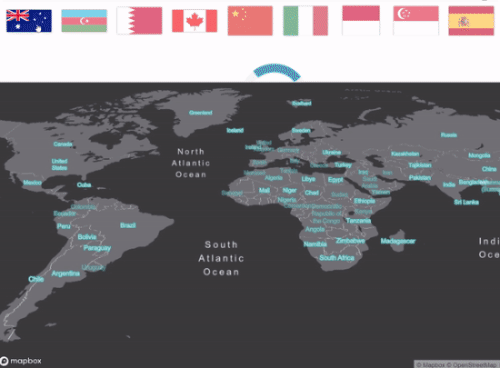
To add points on a custom map you may use another Mapbox Interactive Tool called Marker playground. Using it and JS BinI’ve made a custom map with all 21 Formula 1 Grand Prix which take place this year. The events marked with racing flags. The code below generages the custom maps with F1 Grand Prix marks.
Using the JS Bin you may see what will your map look like
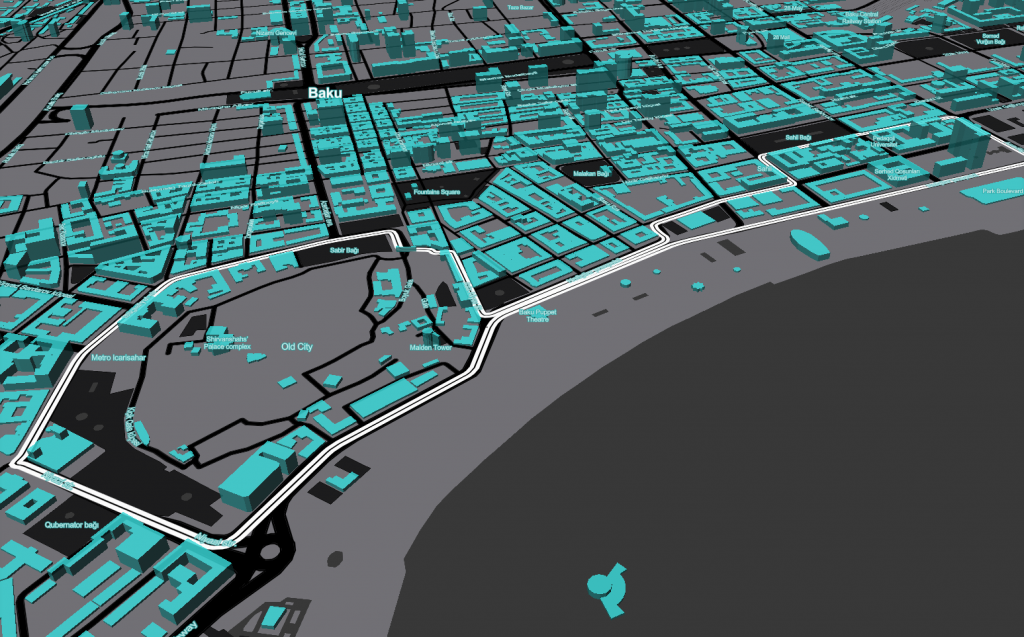
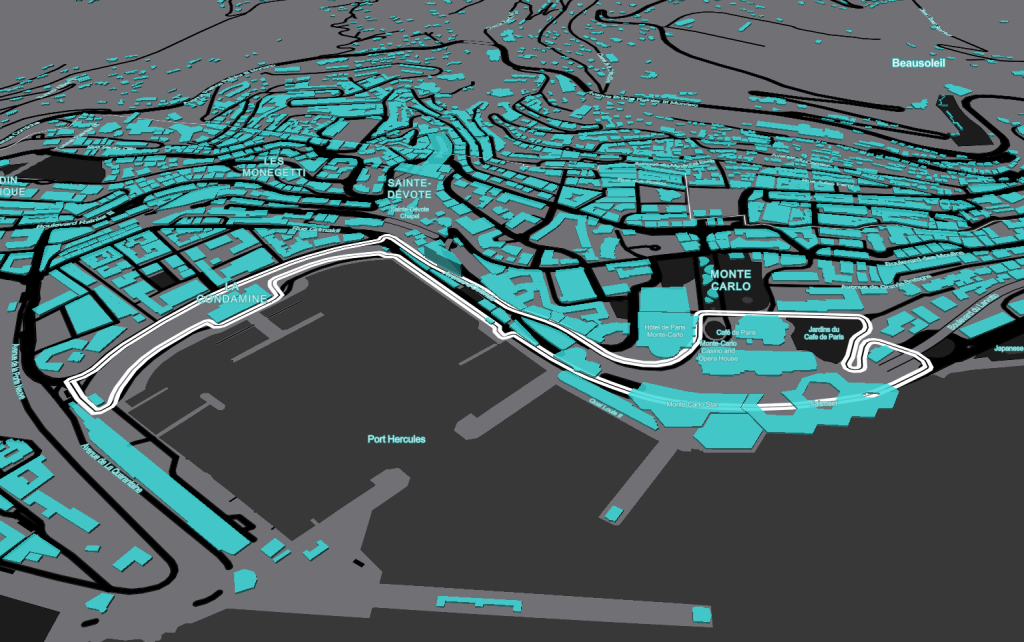
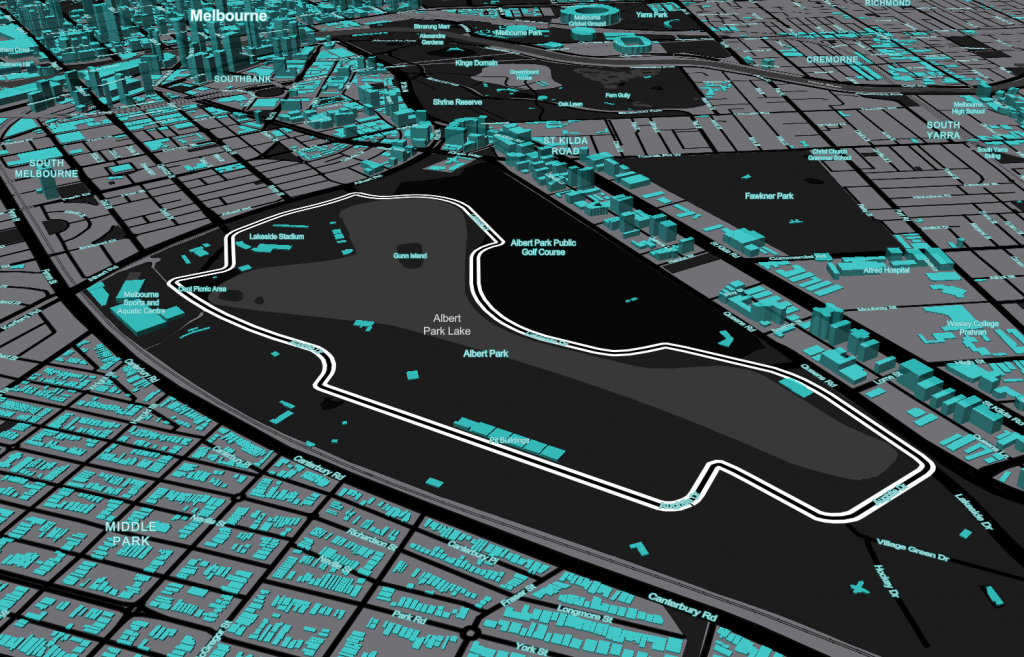
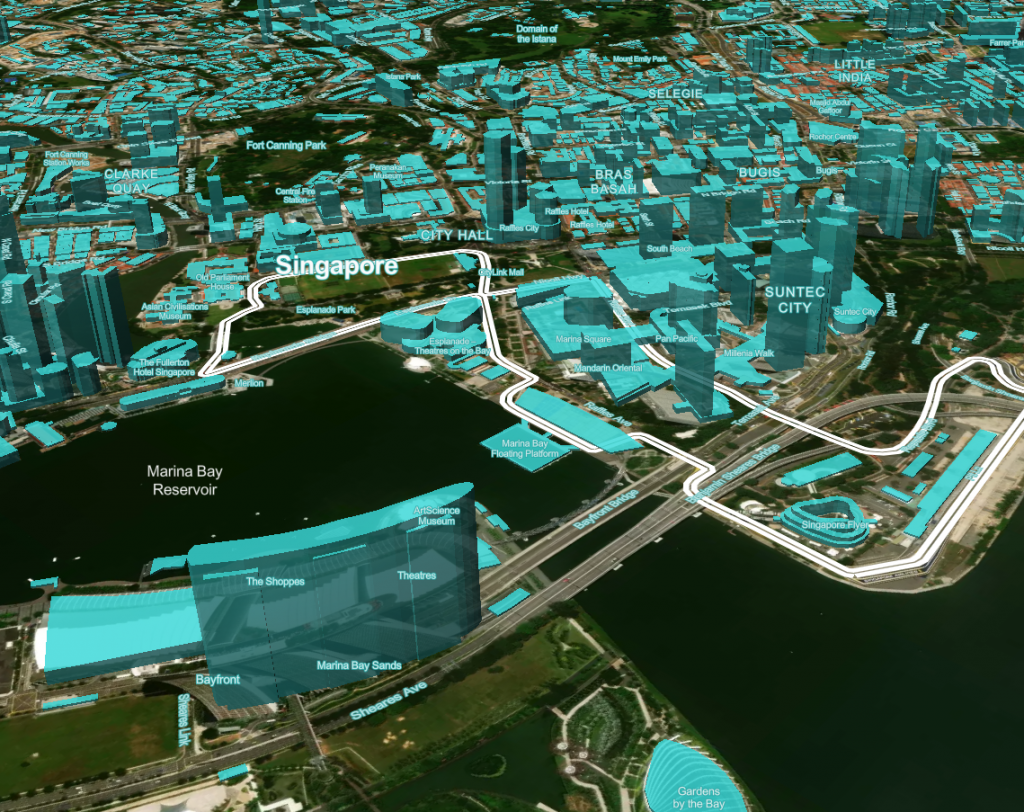
3. Google Earth. Drawing Formula 1 Circuit in the Map
Usually I use Google Earth Pro for geoshapes drawing. To draw trajectories or pathways you should add path (Click ‘add’) in Google Earth. After the path will be finished you may save is as Kml file clicking on the path in the places panel.
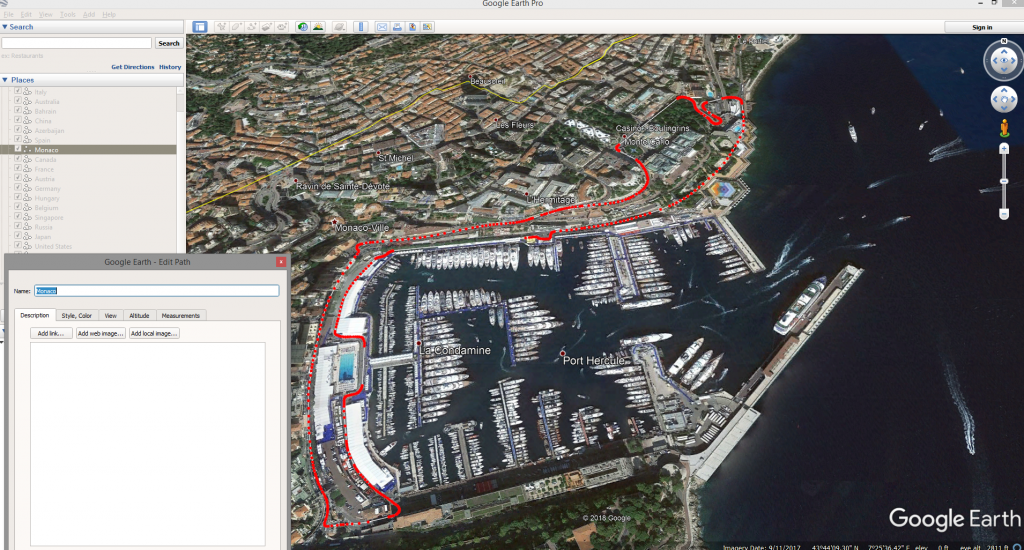
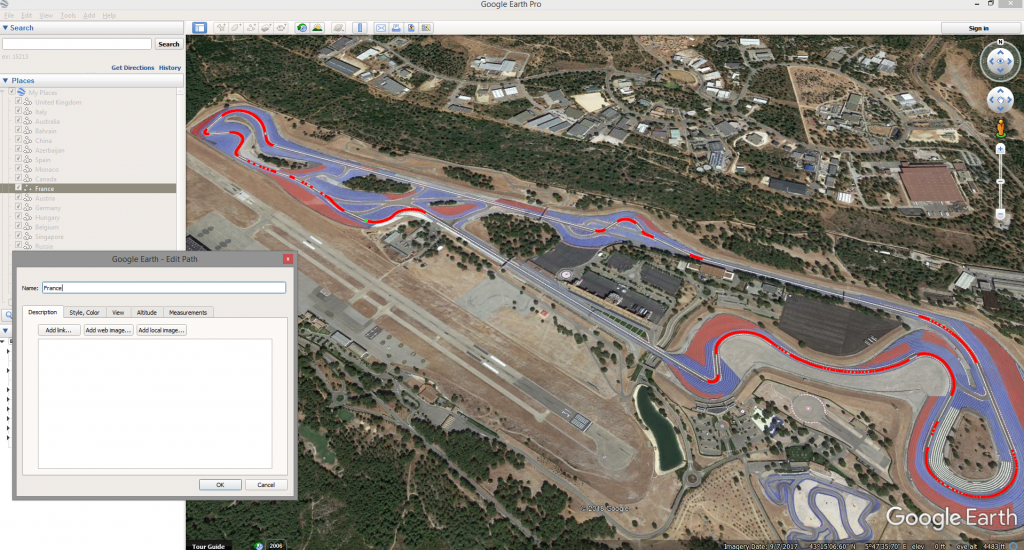
When all pahways will be done you may save all of it as one kml file.
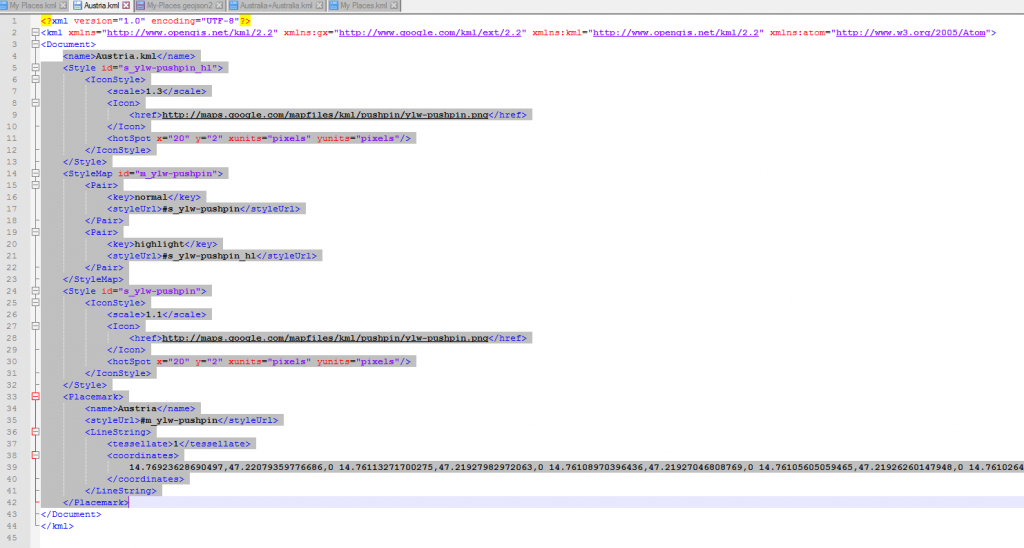
The kml file example below consist information i.e. all points’ coordinates about one Formula 1 Circuit.
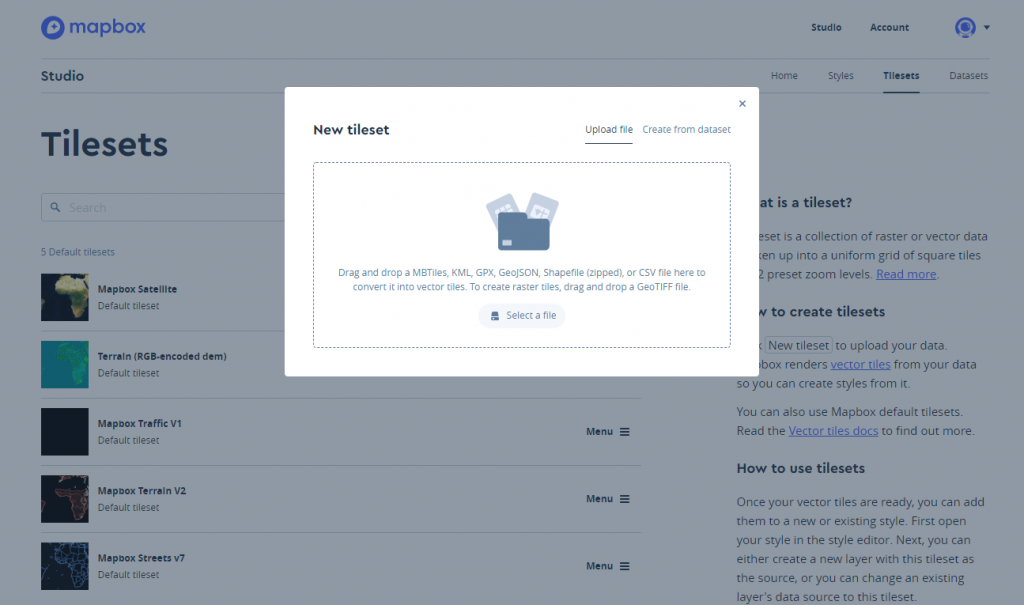
4.Mapbox. Adding Tilesets in the Mapbox custom Map
Mapbox GL JS can use KML, GeoJSON, shape and other files with geodata. You can use Studio-Tilesets for adding your custom pathways, points or polygons or you can drag and drop your file on your custom map. The custom tileset will be available in a minute approximately.
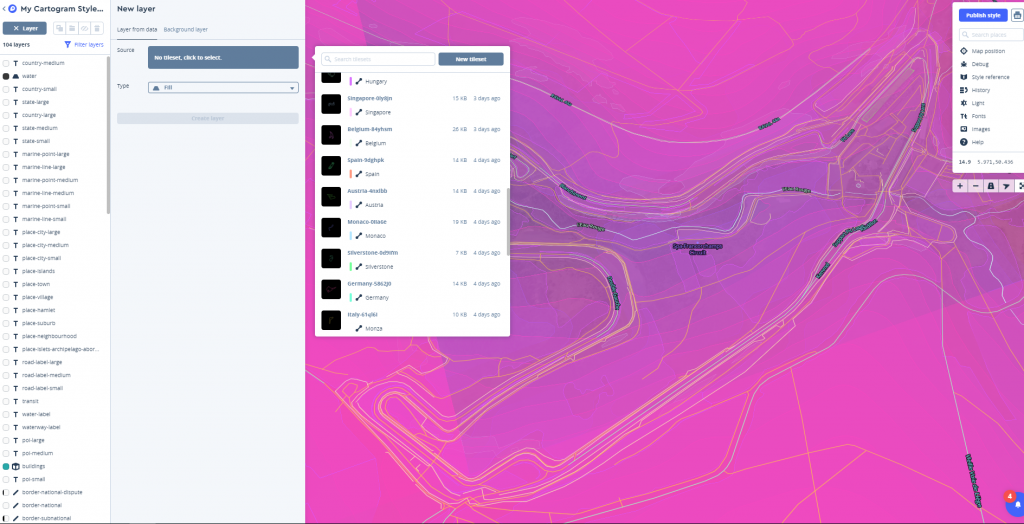
To add your custom tileset on your map you should create a new level and choose your tileset as on the picture below:
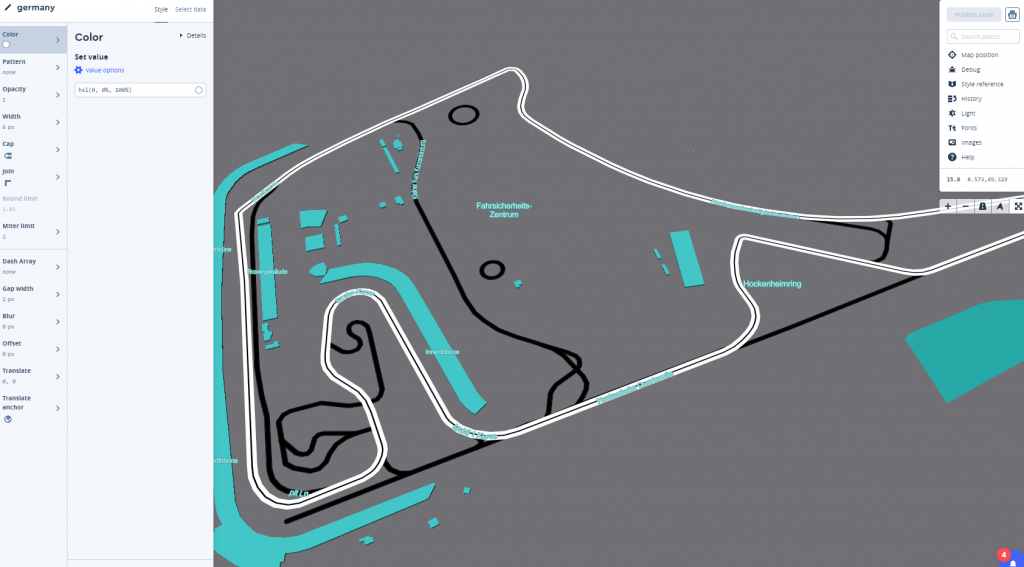
Also you can set some parameters for the new layer. I’ve chosen the color, width=6 and gap=2. The gap splits the pathway into two parts as shown on the picture below. I suppose it looks more ‘racing’.
5. Mapbox. Adding 3rd Dimension
Frankly speaking I did not expect that it would be easy to get a three-dimensional map. The algorithm is not so complex but allow to get the astounding results.
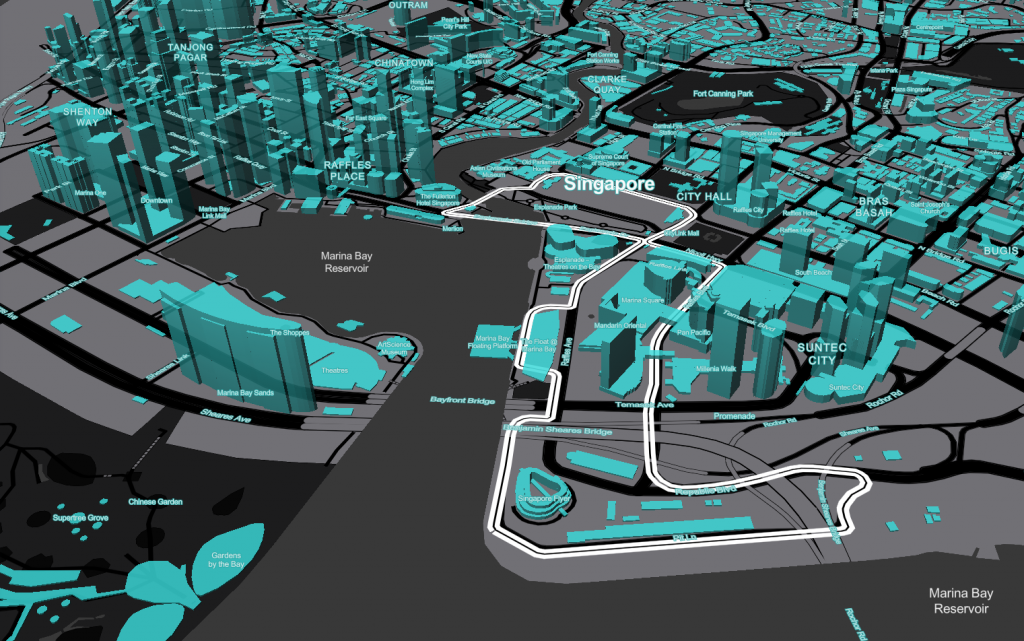
You can set the building heights and opacity.
Finally we have the CUSTOM MAP.
Also it is interesting result if we combine the custom map with satellite tileset:
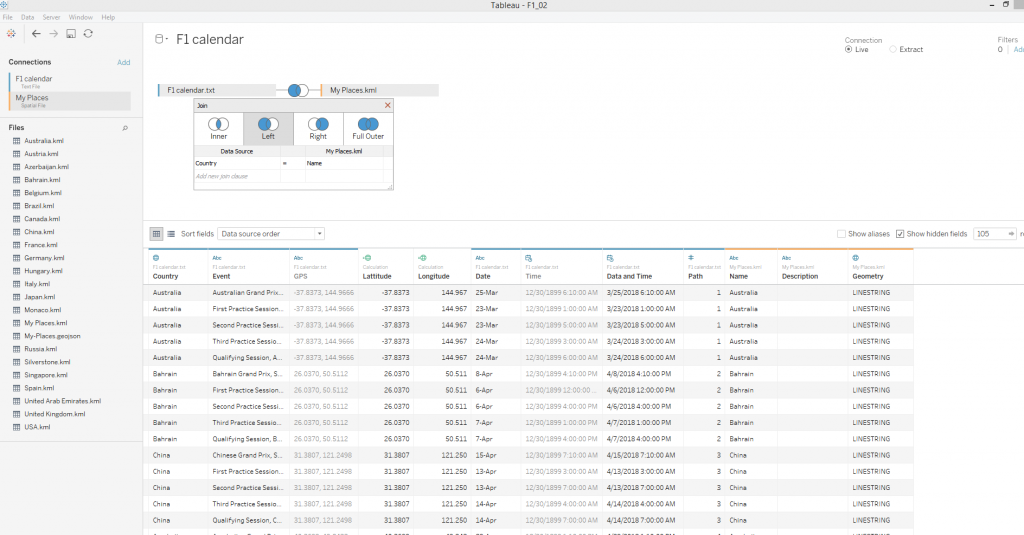
6. Tableau. Data Loading and Integration with Mapbox GL
The web site formula1.com has data about all F1 races this year. I’ve prepared an csv file based on the data. Loading the data in Tableau we also should load the geodata from KML file and merge both sources. So we have all numbers and dates about F1 Races and Geodata as linestrings.
To use Mapbox custom map in Tableau you should copy an integration URL from Mapbox Studio as you can see below, choose Map -Background Map – Map Services and paste the URL in Mapbox GL URL.
Now Tableau can work with custom Mapbox GL Map. The map will be also available after publishing on a Tableau Server.
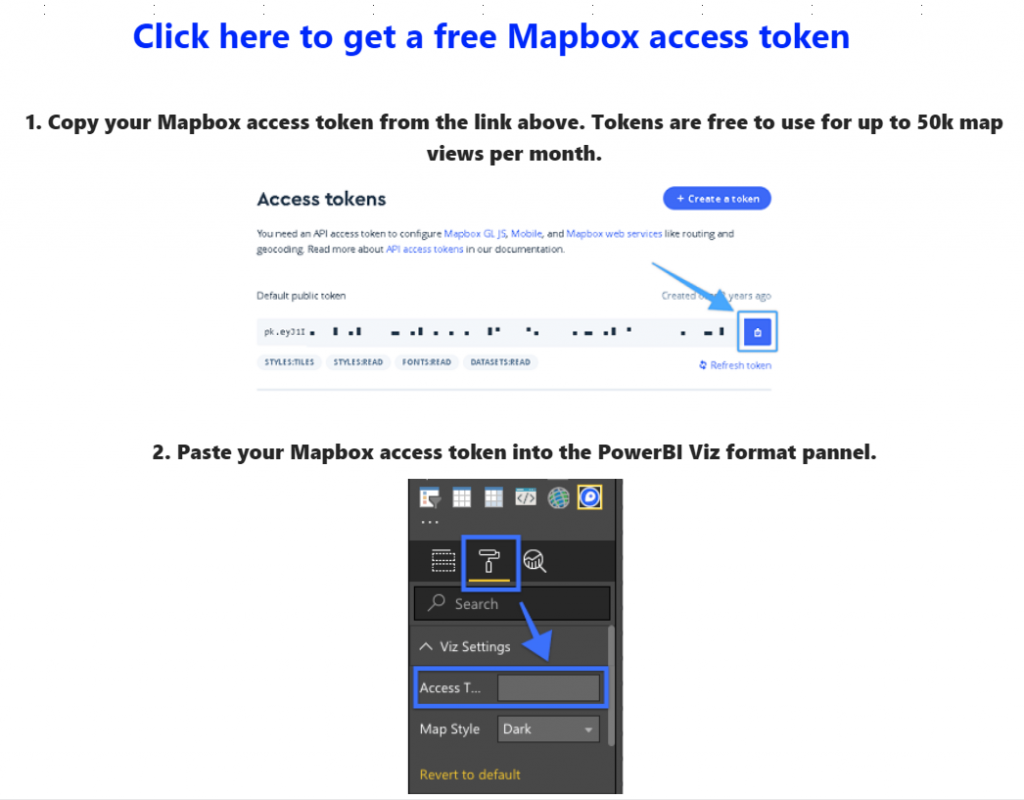
7. Power BI. Data Loading and Integration with Mapbox GL
The latest update of Power BI has Mapbox integration and it is awesome. To start working with the Mapbox GL you should download Mapbox Visual from the store. When you drag and drop data to the visualisation the instruction appears. Just follow it.
Finally the Mapbox GL custom map will be available in the visualization.
You can find other Mapbox maps in articles: “Creating Video with Tableau and Software Robots” and “Contour Plot and Density Estimation in Tableau“.
Conclusion
The new Mapbox GL tools and integration with BI systems allow to improve data analysis and data visualization. Simply map creating and flexible customization allows you to create a map for any needs