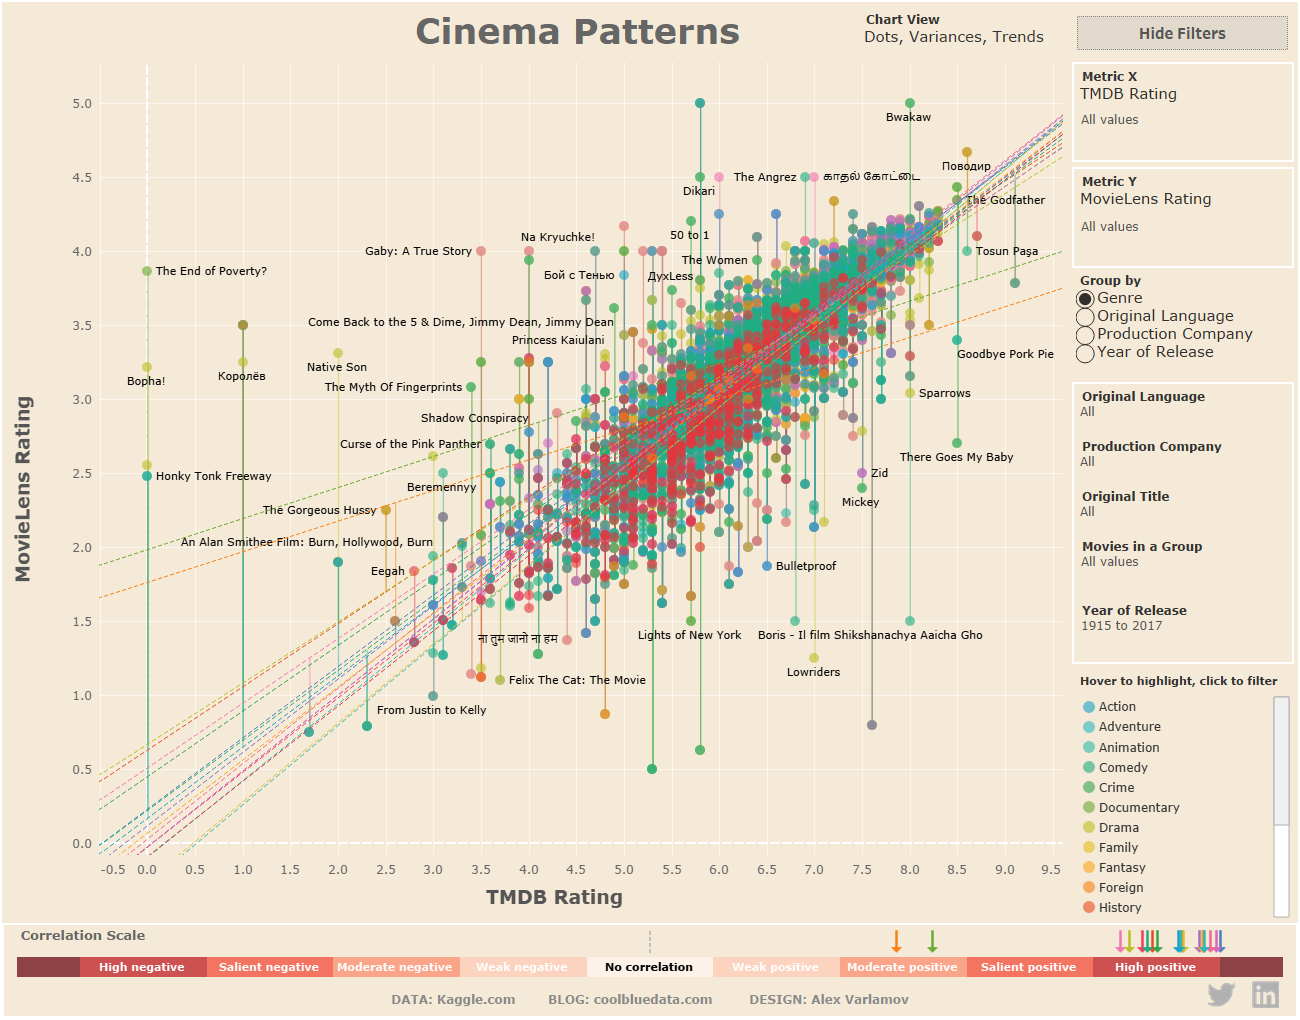
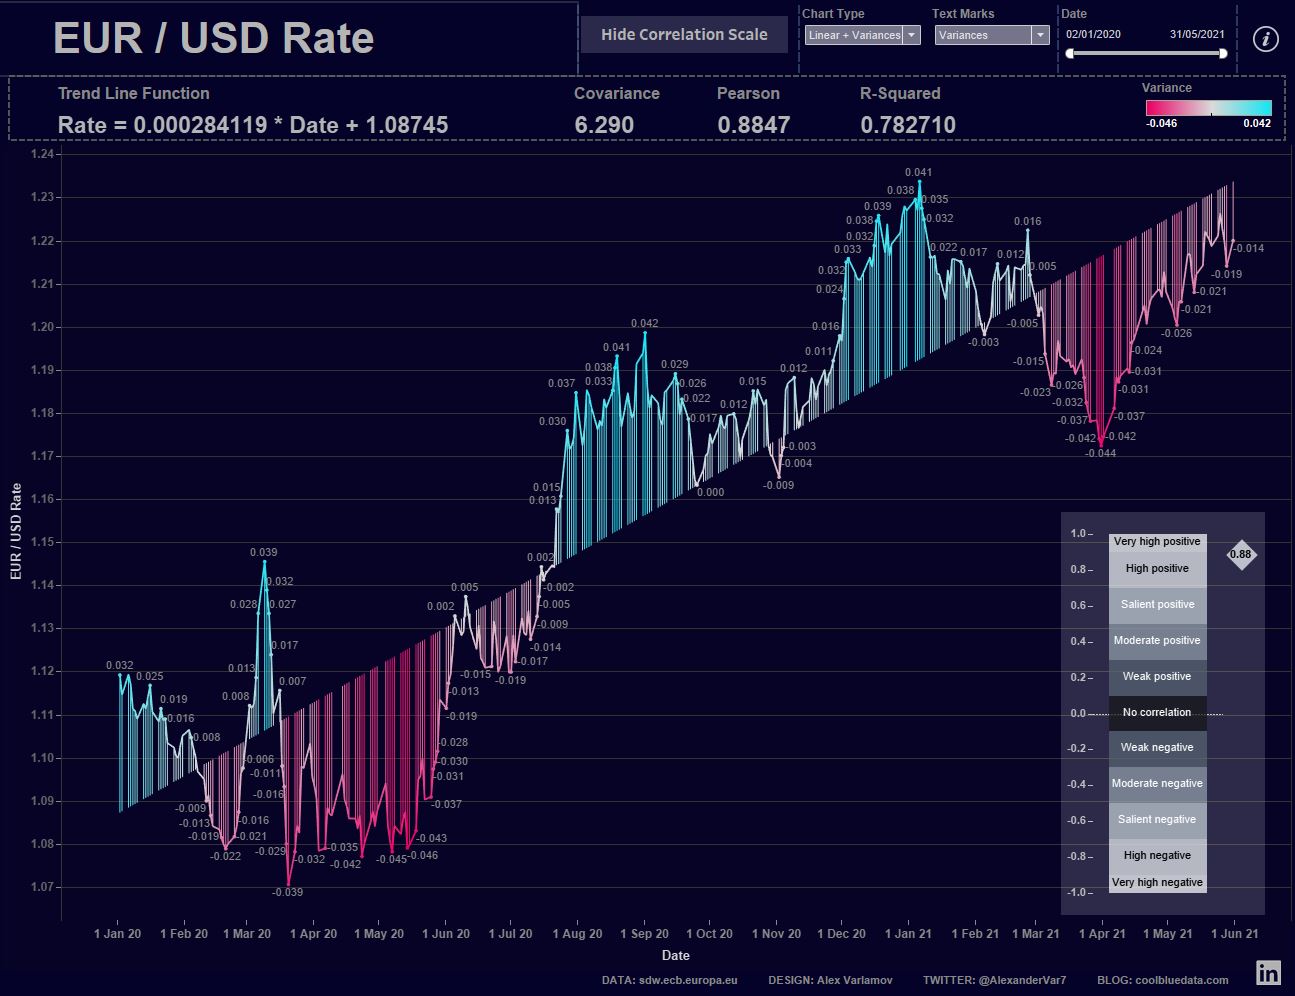
Skip to content
COOL BLUE DATA
  • English (US)
  • Русский

COOL BLUE DATA

  • Обо мне
  • Блог
  • Галерея
  • Видео

Метки

mapbox math powerbi python tableau

math

math, python, tableau

Параметрические портреты в Tableau

8 апреля, 2020

Math is beautiful!
The goal of the article is to show to Tableau users that math it is not only boring numbers and it is possible to describe anything by math equations and draw it.
It’s hard to imagine the dataset for the visualization of portraits contains only 2 values: 0 and 500. The portrait’s curves draw by using parametric equations for X and Y axes.

© 2021 COOL BLUE DATA | Designed by: Theme Freesia | Powered by: WordPress