
Tableau is an analytics tool, and hardly anyone seriously associates it with video creation. In this article, I will talk about how to use Tableau to create images and combine the images as frames into video files using other tools.
1. What does Tableau do natively?
Tableau has an option ‘pages’ (see pages shelf), that allows you to create animations based on data. The idea of this option is displaying a part of the data for each frame. You can also enable the history of previous frames with and without fading.
As a couple examples of the option you can watch the visualizations: a ploygonal dog and How has the world changed since 1962? by Marc Reid.
To animate the vizzes you should press ‘play’ button on playback controls. On the web (since 2020.1 version) there are no settings for the playback and you can’t watch the animation at high speed because each frame is generated by a request to the server, and this takes time. In Tableau Desktop for Pages, you can select only 3 speeds.
In addition, for the Pages option to work correctly, a certain data structure is needed because Pages animates the visualization by a field or a calculation. With a big data set and a lot of marks on the visualization, the “freezes” will be noticeable, i.e. Tableau is not be able to quickly process all Pages in real time.
Tableau не может нативно автоматически создавать анимацию при помощи параметров – для этого нужно вручную изменять значение нужного параметра.
Tableau cannot natively create animations using parameters. For this you need to manually change the value of the desired parameter.
Note: Mentioning ‘animation’ in this context I don’t mean the ‘Viz Animation’ feature, I’m telling about ‘Pages’ feature.
2. Video that can be created from Frames generated by Tableau
The limitations mentioned above do not allow Tableau to create video of any frame rate and resolution. You can, of course, use a video capture of your screen and record a video, and then speed it up in any video editor, but frames will have different durations due to real time Tableau and capture tool performance. Such video will not be high quality.
For a smooth video stream with the same frame rate, you can draw each frame in Tableau, save it as PNG, and then combine all the frames into an animated GIF or video file.
An example of such an animated file is shown below – it shows the growth dynamics of counties in the USA by years. In fact, in a few seconds you can see the history of the emergence of the US, the sognificant events are reflected here, for example, the purchase of Louisiana in 1803. The idea for this visualization was proposed by Egor Larin, for which many thanks to him.
The next GIF is the result of merging frames. There are only 2 values in the dataset (the portraits are drawn with mathematical functions), therefore, Tableau Pages Shelf will not work. It takes approximately 20 seconds to render each frame of the viz in Tableau due to the complexity of the functions.
Such animated GIFs or video files can contain up to 2000 frames (actulally, you can make any number of frames if desired). For the GIF above, each portrait has 120 – 500 frames. The frame numbers are indicated in the upper right corner.
The problem here is to render and save these frames. Tableau can export any viz to PNG, but you need to repeat this export 2000 times. It does not make sense to waste time exporting manually.
Formally, the process of generating a picture is simple. You need to create the first frame, save it, increase the parameter by one value, save the next frame, and so on until the last frame. The algorithm is quite simple, it deals with mouse clicks at certain places on the screen and typing frame numbers on the keyboard.
Instead of us, robots can do it!
3. Robotic Process Automation
Routine processes can and should be automated. I do not like to do manual operations on a PC that can be executed by scripts.
The abbreviation RPA (Robotic Process Automation) is now quite common in IT. The main idea of the routine processes automation is the management of certain applications through other applications (software robots) that interact with the interface, performing actions similar to user actions. Or, if simpler, software robots do the routine work for you on your PC.
There are commercial solutions like Blue Prism or UIPath, but they will not work for us – we would like a free analogue. When I was looking for a free product, Artem Prytkov from the Russian-speaking Tableau community recommended me AutoHotkey. Thanks, Artem!
AutoHotkey is a free, open-source custom scripting language (that exists over 16 years) with an application. There are a community and a forum where you can find answers to your questions. For AutoHotkey, you need to write scripts for the interface interaction, after which the program is minimized to tray, and the scripts emulate the mouse and keyboard actions, performing a sequence of script operations.
Note: the following steps and scripts work only in Windows. On my Mac, I do not use this program.
You can download this program from the official website of autohotkey.com, there is also a forum with examples of scripts. The program installs without problems. Scripts are written in text files (I use Notepad ++ for this). By assigning the .ahk extension to these text files, you bind the files to AutoHotKey, so you can run scripts simply by clicking on these files.
It should be noted that all the operations listed below can be implemented in a programming language, for example, in Python. But in the final implementation, they will be more complicated.
4. AutoHotkey Scripts
Let’s write the first script and run it to understand how AutoHotkey works. The script will do only one operation – right-click in 1 second. It is launched by pressing the F8 key; exiting the script is Esc.
SetTimer Click, 1000 ; Set click delay 1000 ms

F8::Toggle := !Toggle ; Wait for F8 to start

Click: ; Run infinite cycle of clickingxc z
    If (!Toggle)
        Return
    Click

return

Esc::ExitApp  ; Exit script with Escape key
Regarding Tableau, this script can be useful for an autoclick with a given frequency for parameter control. In computer games, it works like Autofire. That is, it is a simple clicker.
Having inserted a string Send a after the string Click, we will tell the script to send the character “a” after each click. This is essentially an emulation of keystrokes on the keyboard.
The next useful script is Get Cursor Position. This is a script to capture the cursor position.
SetTimer Click, 10000 ; Initial delay 10 seconds

F8::Toggle := !Toggle ; Wait for F8 to start

Click:
    If (!Toggle)
        Return
    MouseGetPos, xpos, ypos ; Return cursor position
	MsgBox, The cursor is at X%xpos% Y%ypos%. ; Message box with X,Y coordinates
return

Esc::ExitApp  ; Exit script with Escape key
After starting the script by the F8 key, the cursor position will be captured in 10 seconds and the Message Box with the X and Y coordinates will pop up:

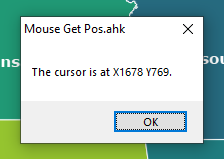
The idea of this script is to collect the coordinates of all the points on the screen where you need to click by mouse. We will insert these coordinates in the following script. On the picture above, the coordinates of the parameter arrow were captured.
Note: do not ignore the exit command by Esc key, otherwise you will have to try to stop the endless clicks with your hands. Include it in every script.
Let’s now write the most important script that will move the controls and save each frame. The coordinates of click locations were captured by the previous scrip, they must be paste in the following script:
SetKeyDelay, 800 ; Key pressing delay 800 ms
SetTimer Click, 1000 ; Click delay 1 second

F8::Toggle := !Toggle ; ; Wait for F8 to start

Click:
    If (!Toggle)
        Return

	Loop, 1056 ; Loop where 1056 is number of frames
	{
	Click, 1850, 702 ; Click on a parameter arrow with coordinates 1850, 702
	sleep, 2000 ; Wait for 2 seconds to draw a frame in Tableau
	Click, 193, 43 ; Click on 'Dashboard' pane with coordinates 193, 43
	sleep, 1000 ; Wait for 1 second
	Click, 239, 221 ; Клик на выпадающей вкладке Export Image
	sleep, 1000 ; Wait for 1 second
	var = A_Index ; Start a sequence 1,2.. etc.
	Send %A_Index% ; Press numbers 1,2.. etc, numerating frames
	Send {Enter} ; PressEnter
	sleep, 1000 ; Wait for 1 second
	}
	MsgBox, Done!. ; Message box 'Done!'

Esc::ExitApp  ; Exit script with Escape key
This script works as follows:
- Waiting for F8 to start
- After pressing F8, clicks on the arrow to increase a parameter.
- Pause 1 second
- Click on the ‘Dashboard’ drop-down tab.
- Pause 1 second
- Click on ‘Export Image’
- Pause 1 second
- Enter frame number + Enter
- Pause 1 second
- The cycle repeats
- After saving all frames, the ‘Done!’ window is displayed.
Before running the script, you need to save the first frame to the destination folder, i.e. manually export the initial state as 0.png or 0.jpg to the folder. This way you define the folder where all frames will be saved.
Below shows how the script works after it starts:
1 second pauses between operations were selected so that Tableau could draw a frame and save the picture. In fact, these delays can be reduced, they depend on the complexity of the visualization and the your PC power. If we leave the delay for rendering for 1 second, reduce the delay of pressing the keys to 0.2 seconds and reduce the remaining delays to 0.5 seconds, the whole process will be significantly accelerated:

You can also speed up the process so that you don’t even see window opening and saving frames. It must be remembered that with small delays it may turn out that Tableau processes will not be in time for clicks, and nothing will work. Therefore, it is better to choose delays with a margin, giving Tableau a little thought.
Note: launching the script, remember that it work not only with Tableau, and it can click on the desktop if you run it there, having done a lot of bad things. It’s better to disable all background programs with pop-ups.
You can export frames as .png and .jpg. The JPEG format compresses files, the compression artifacts is formed on them, It will affect the quality of the final video. It is better to use the .png format if you need to get high-quality video.
Note: the size of a .png file can be more than 2MB, and 1000 frames will take more than 2GB, so check the free disk space before running the script.
You also need to remember that Tableau saves the previous steps in RAM, and in complex visualizations, every next frame or step in Tableau consumes a part of the RAM. The more such steps are taken, the less free memory will remain, and at one point the memory will end, and Tableau will stop working (there will be an ‘Out of Memory’ error). That is, Tableau cannot store an infinite number of steps in memory because the number is restricted by computer resources. You must remember this too.
5. Making Video from Frames
So, the last script generated frames for you, which now need to be converted to GIF or video format. If there are few frames, you can use online converters, for example EZGIF. Online converters limit the size of files and the number of frames. For EZGIF, the maximum file size is 100MB, I didn’t have enough at some point, so I use conversion tools.
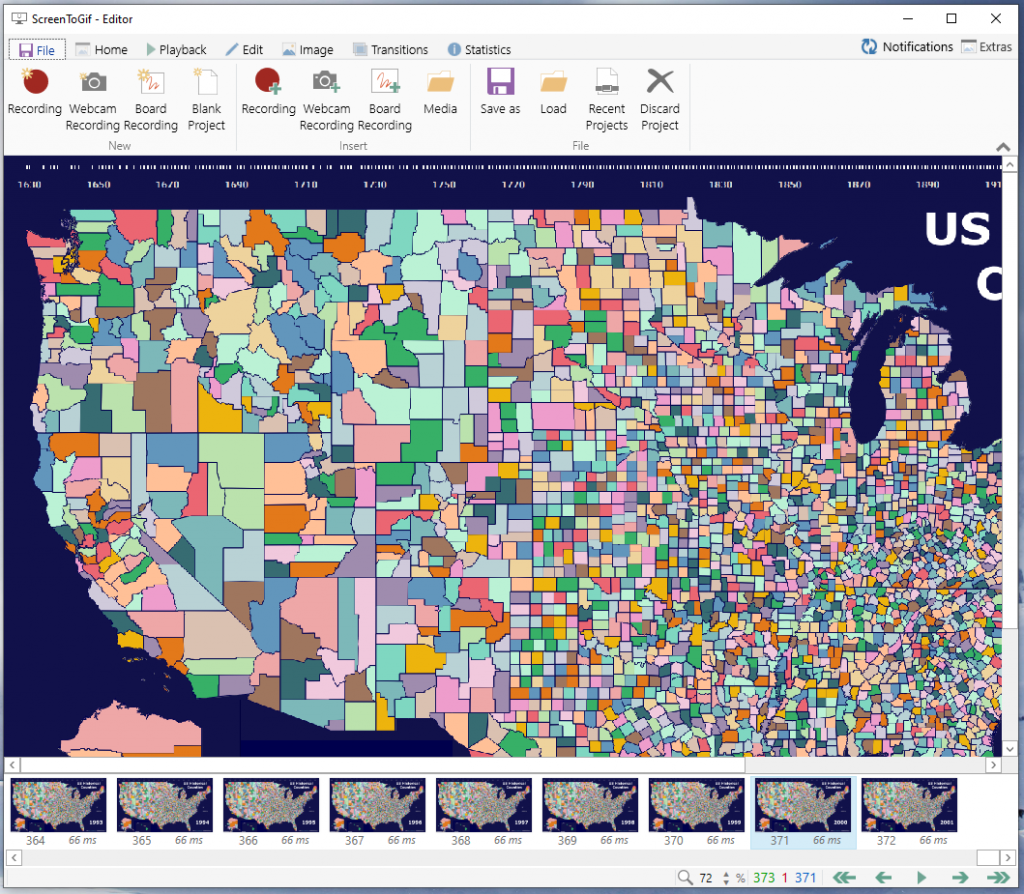
The tool, in which we will make videos, is called ScreenToGif. It can be downloaded on the official website.
After launching ScreenToGif, click ‘open file’ and download all frames at once:
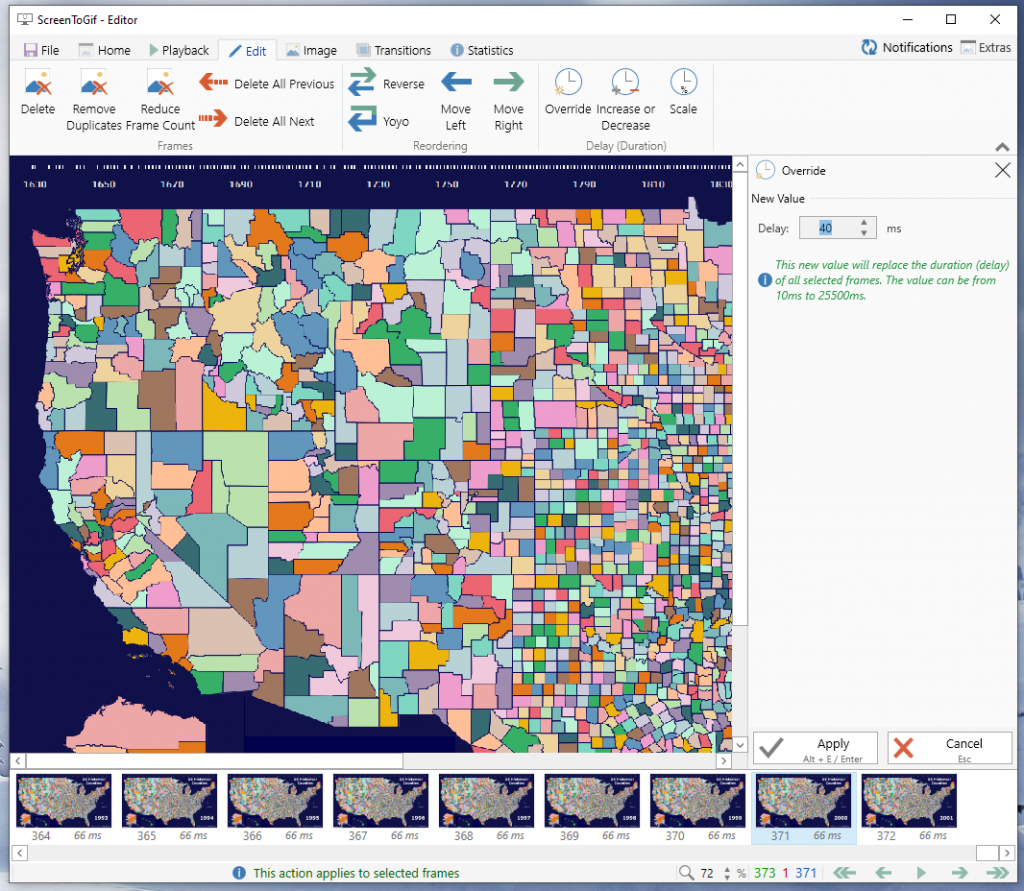
You can change the duration of each frame or all frames at once:
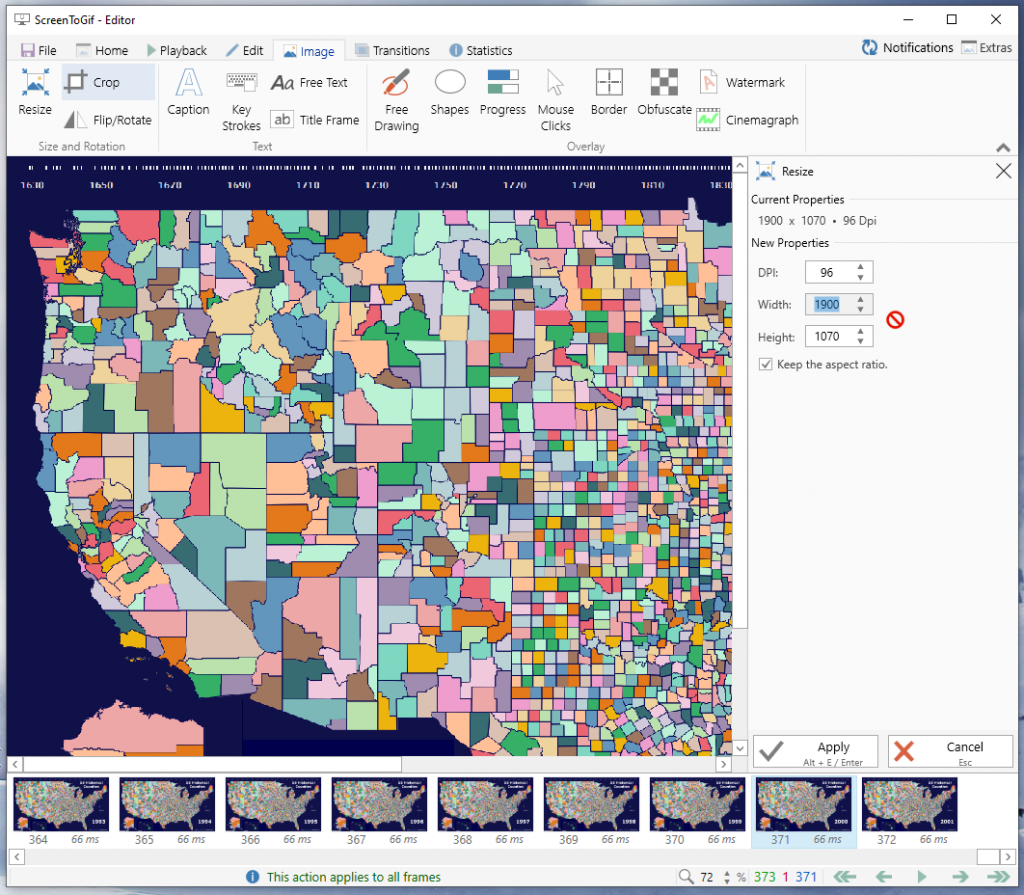
You can resize frames or cut off excess:
The program is understandable enough, so do all the operations on frames and save the project as GIF or .MP4.
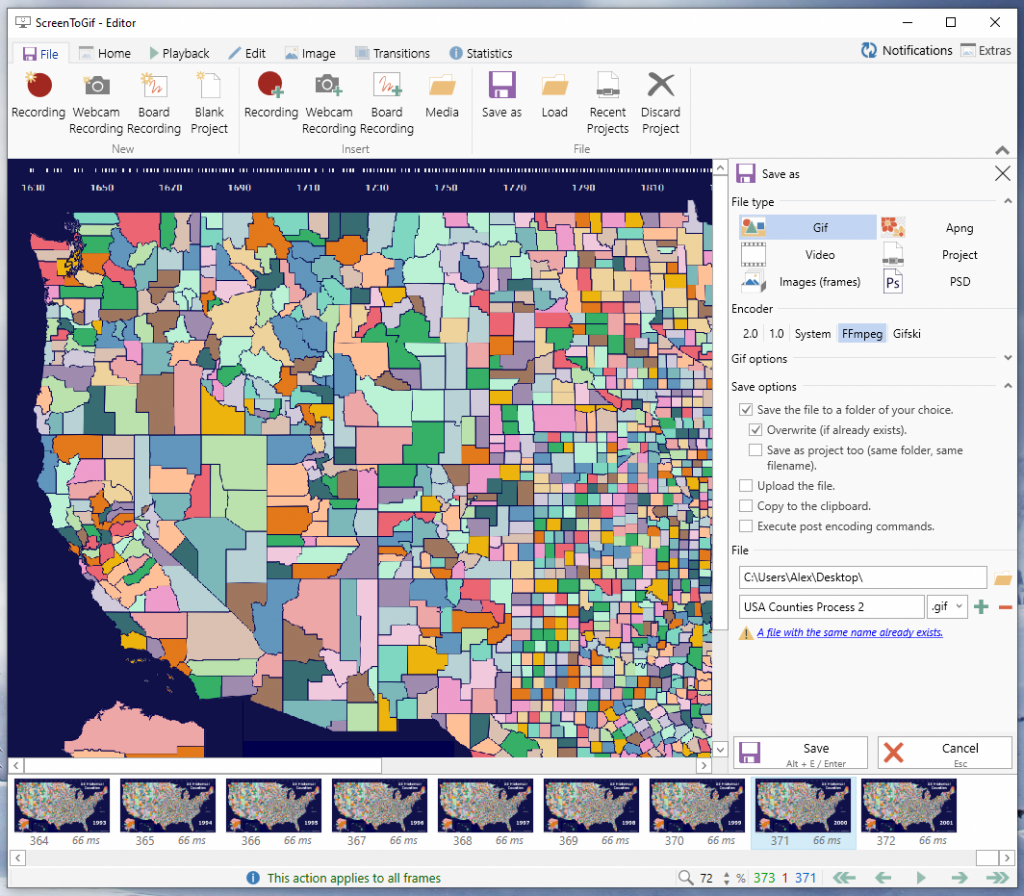
Well done! Your video is ready.
During exporting visualizations to .png and .jpg, the values of the parameters and filters remain in the places where they are on the visualizations. If the numbers are not needed, you can remove them in Tableau to a container on the right side of the dashboard, and cut off this area in ScreenToGif.
ScreenToGif also stores all images in a temporary folder. On my computer, this is C: \ Users\Alex\AppData\Local\Temp\ScreenToGif\Recording
But you can change this path and storage time in the program settings. By default, the storage time is 7 days, and if you often use this program, this folder will takes a lot, so it’s better to clean it more often.
The advantages of this approach in comparison with Pages are the data structure can be any, and if you configure parameters, filters and highlights in the visualization so that you can get any desired frame with their combination, you can change the values of several controls, and then save the frames. For example, see a GIF below where two parameters are changing for each frame: the angle of rotation and the height of the building.

Conclusion
The article examined the processes of creating simple software robots that help performing routine operations with user interfaces. Such robots work with any PC interface, not only with Tableau. In relation to Tableau and business tasks, such robots can switch visualizations during presentations on large screens. You can make a robot that completely creates any visualization according to the sequence of operations in a few seconds. I wonder if this contradicts IronViz rules?
Videos that are created in this way work very well to quickly perceive data in a few seconds. The videos can be inserted into articles, placed on websites, used in presentations.