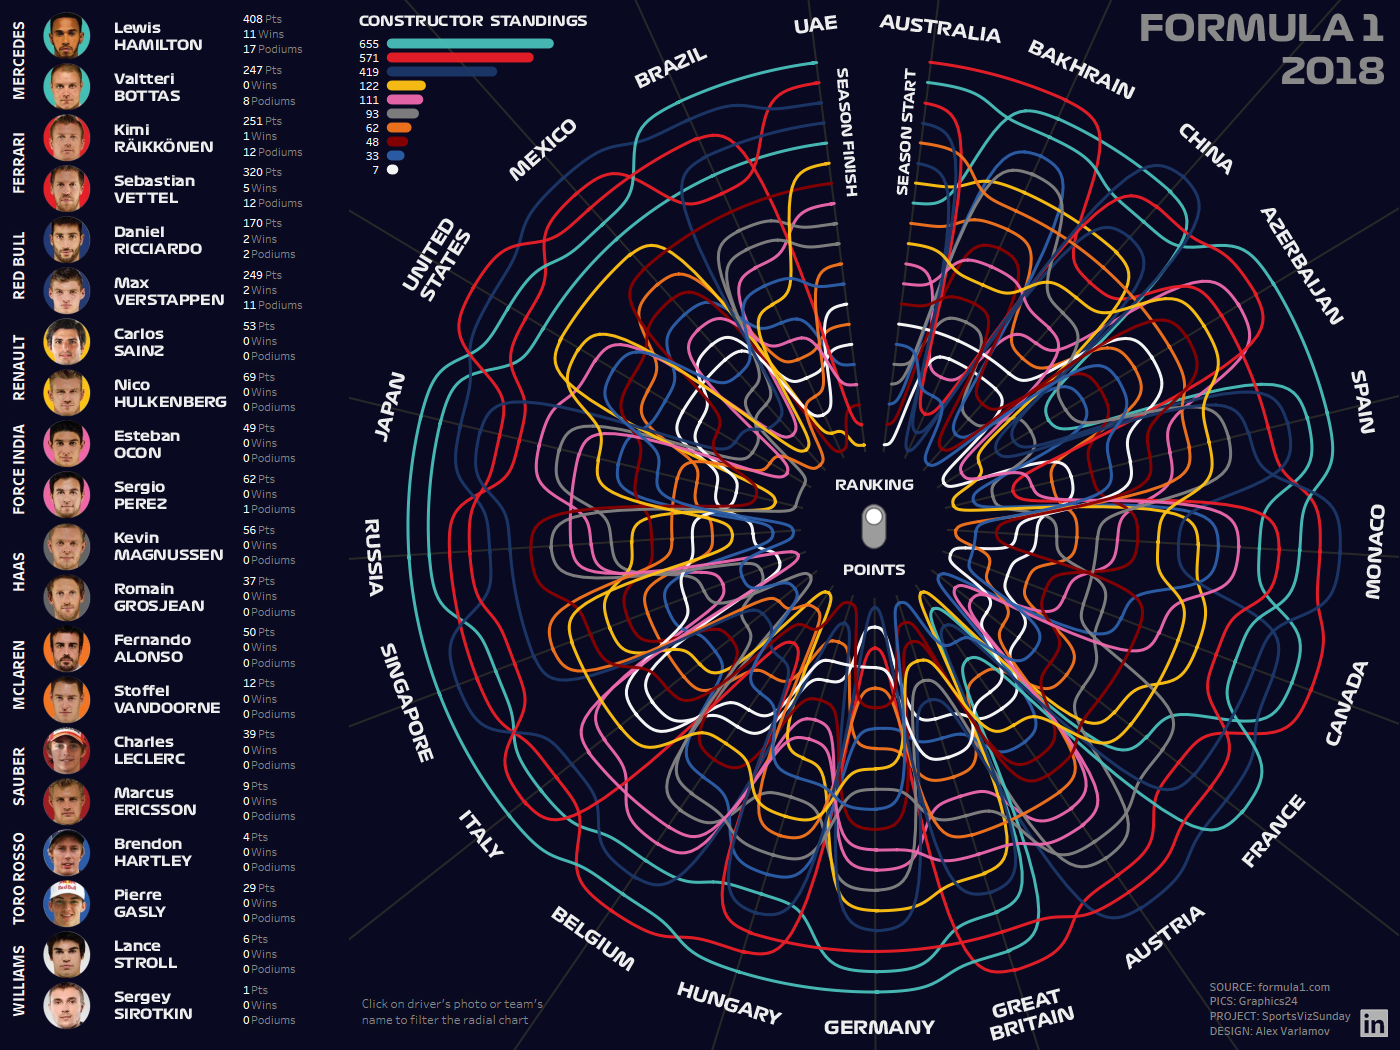
Skip to content
COOL BLUE DATA
  • English (US)
  • Русский

COOL BLUE DATA

  • About
  • Blog
  • Gallery
  • Talks

Tags

mapbox math powerbi python tableau
tableau

Creating transparent Bar Charts in Tableau

March 25, 2020

The blog post describes how to create transparent bar charts using the Transparent Sheets feature.

mapbox, powerbi, tableau

Using Mapbox GL JS custom Maps with Tableau and PowerBI

March 23, 2020

The Mapbox tools are amazing things that can empower spacious data analysis and visual analytics. Tableau and PowerBI are efficient analytics software for complex analytics challenges and astounding data visualizations. Connecting monsters in geomapping and BI we can create powerful tools for the spacious analysis.

  • Next Page »
© 2021 COOL BLUE DATA | Designed by: Theme Freesia | Powered by: WordPress