
Disclaimer: 3D models in Tableau are not always the best option for analytical and business cases, but you can use them in bespoke visualizations or simply for fun. In any case, you can extend your knowledge about Tableau by creating such models.
Tableau public has visualizations made by using 3D technique. See the links as examples below.
1. The things we know about 3D in Tableau
I’m definitely not the first person to build 3D models in Tableau. Noah Salvaterra pioneered these techniques when he created a 3D Tesla. Bora Beran simplified his technique in his blog, Going 3D with Tableau. Allan Walker applied “shaders” – Guassian filters, slope, smoothstep functions. And Anya A’Hearn worked with Philip Riggs built the STL to TDE/Hyper convertor in Alteryx, as detailed in The 3D Full Monty.
Big thanks to Allan Walker, who shared the above history with me. If you have not seen the above or read these blogs, please take a few minutes to do so.
The Tableau community is so amazing and I have personally be inspired by all these methods, having used them to create some of my own 3D models in Tableau. There are a number of tools available for creating 3D models, including Blender (free), Meshlab (free), or SketchUp (not free). These tools allow you to export your model to ASCII STL (stereolithography) files. One such process is described in Anya’s article. Each row in a STL file represents a vertex and the format works with only triangles (polygon with 3 vertices). Anya’s blog contains a link to an Alteryx flow which converts the STL file to a TDE (Tableau Data Extract). I, like many others, don’t have an Alteryx license so I used a Python script for parsing the files. You can find my code here: https://github.com/AlexVarlamoff/Blender_Dots_ASCII_STL_to_csv_Converter/blob/master/STL_to_CSV_dots_converter.py
But you do not need Alteryx or Python to get data from .STL file — you can do it right in Excel.
The .STL format contains data about vertex coordinates (X,Y,Z) for each polygon with 3 vertices. .STL is a text format, so you can use Notepad for opening and editing it (I use Notepad++).
Let’s look at a fragment of a .STL file:
facet normal 0.000000 0.000000 1.000000
outer loop
vertex 1.000000 1.000000 1.000000
vertex -1.000000 1.000000 1.000000
vertex -1.000000 -1.000000 1.000000
endloop
endfacet
We only need to keep the rows with a prefix of “vertex”, then numerate the rows. To do that, follow these steps:
1. Open your .STL file in Excel, check ‘space’ as delimeter
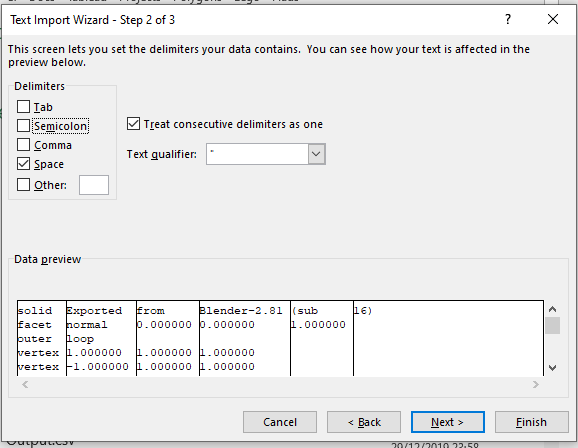
After finishing you can see something like this:
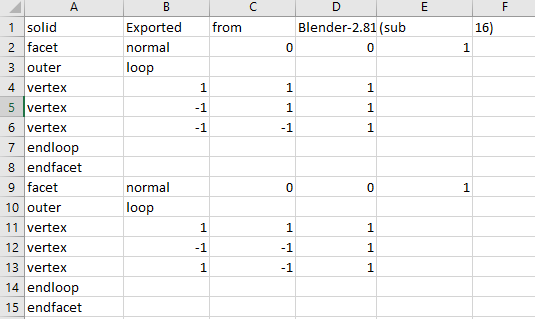
2. Filter the data set for only those with “vertex” in column A removing other rows. Instead of filtering, you can also just sort by column A and remove all rows that are not “vertex”.
3. Add a new column in front of column A called ‘Vertice_id’ and numerate rows (1,2,3,4, etc.). This will uniquely identify each vertex.
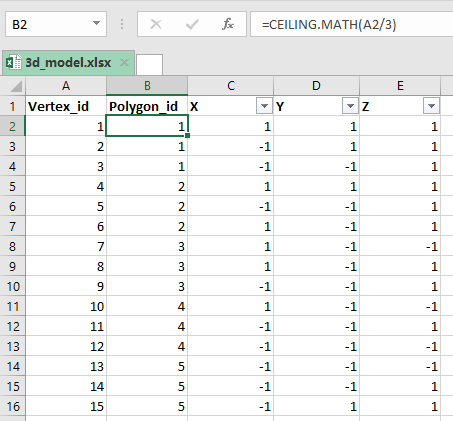
4. Add another column, ‘Polygon_id’ with a calculation: =CEILING.MATH(A2/3). This will uniquely identify each polygon.
Rename columns C,D,E columns to X,Y,Z and remove all other columns. In the end you will have a something like this:
Save the file as .xlsx or .csv and connect to it in Tableau.
Use the X,Y and Z fields for creating a preview, so you can check you model at a glance.
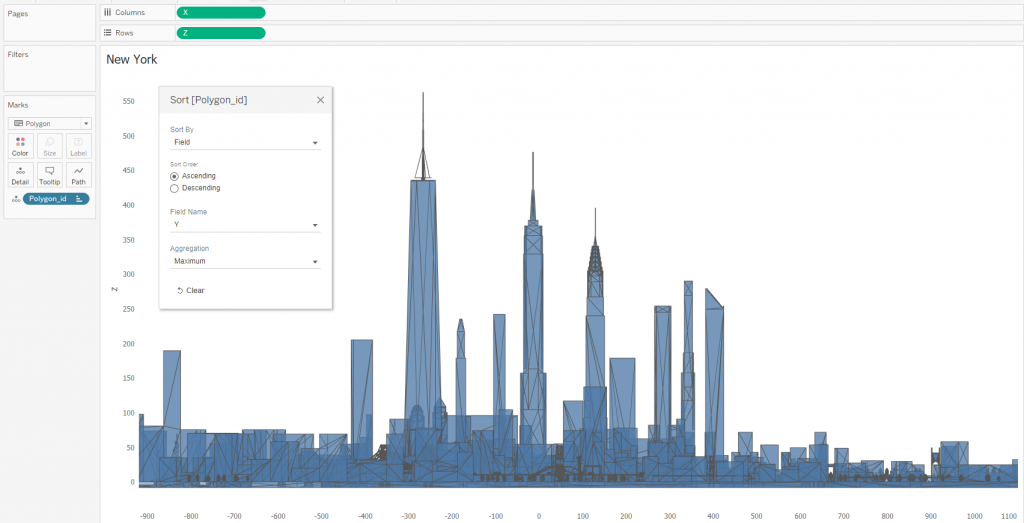
You can notice that the polygons on the pic above were sorting by Y axis in ascending order, so it can explain by painter’s algorithm. The painter’s algorithm sorts all the polygons in a scene by their depth and then paints them in this order, farthest to closest. You can find out more about the algorithm .
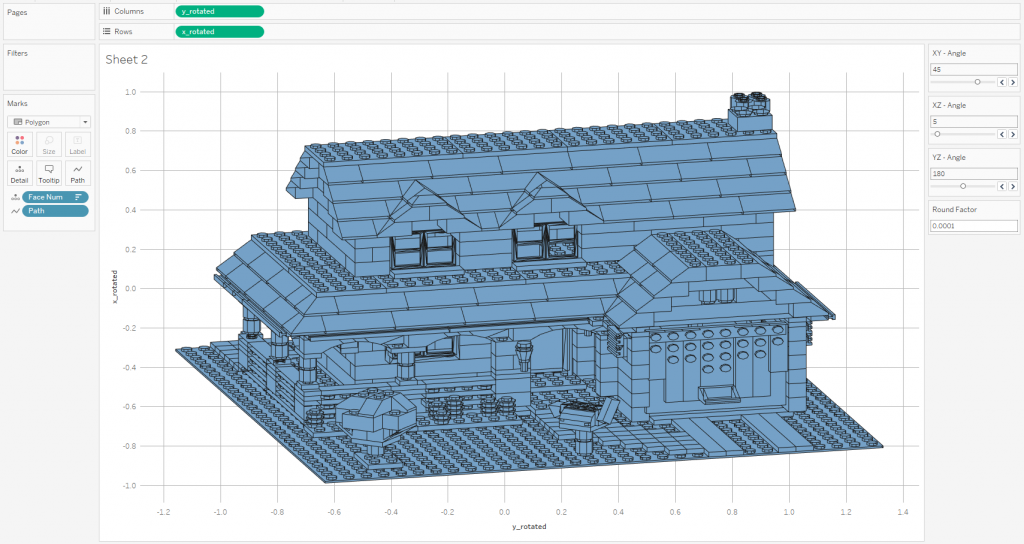
For rotation you will need to create 3 parameters: XY-Angle, XZ-Angle, YZ-Angle and 3 calculations: x_rotated, y_rotated and z_rotated. I copied and pasted the calculations from Anya’s workbook . The formulas calculate projection onto a plane. You can now use these calculated fields in place of X, Y, and Z. Now, when you change the parameter values, the model will rotate. We can also add color. There are a variety of things you can do here, including coloring by Polygon_id or a calculation based on X,Y or Z. For instance, below I’ve colored based on the average of X.
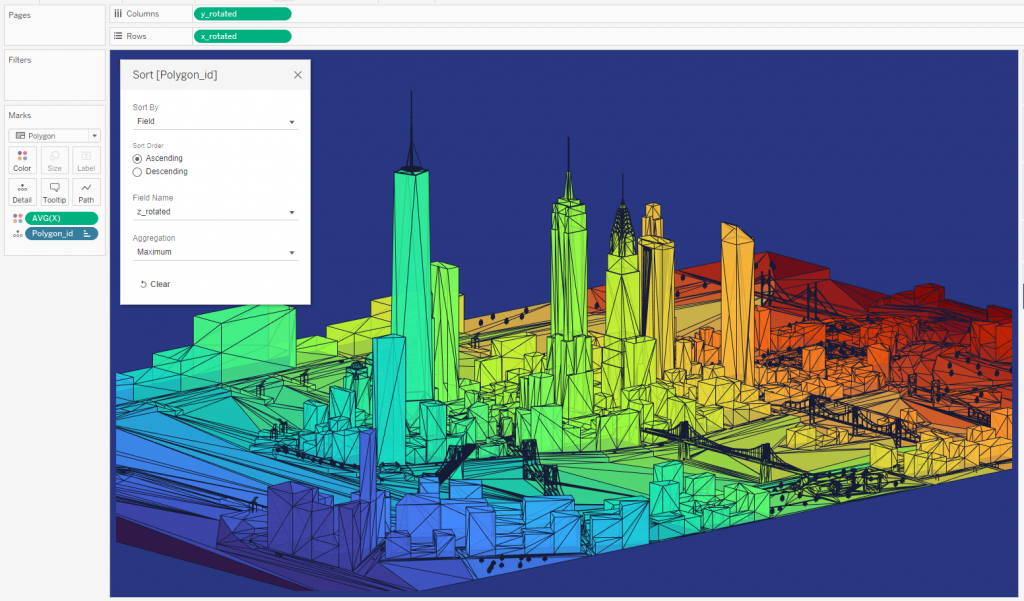
And, with this, our 3D model is complete.
NOTE: As noted previously, I haven’t done anything new here — I’ve just followed the method described by Anya’s A’Hearn. The only thing new is using Excel to prepare the data instead of Alteryx.
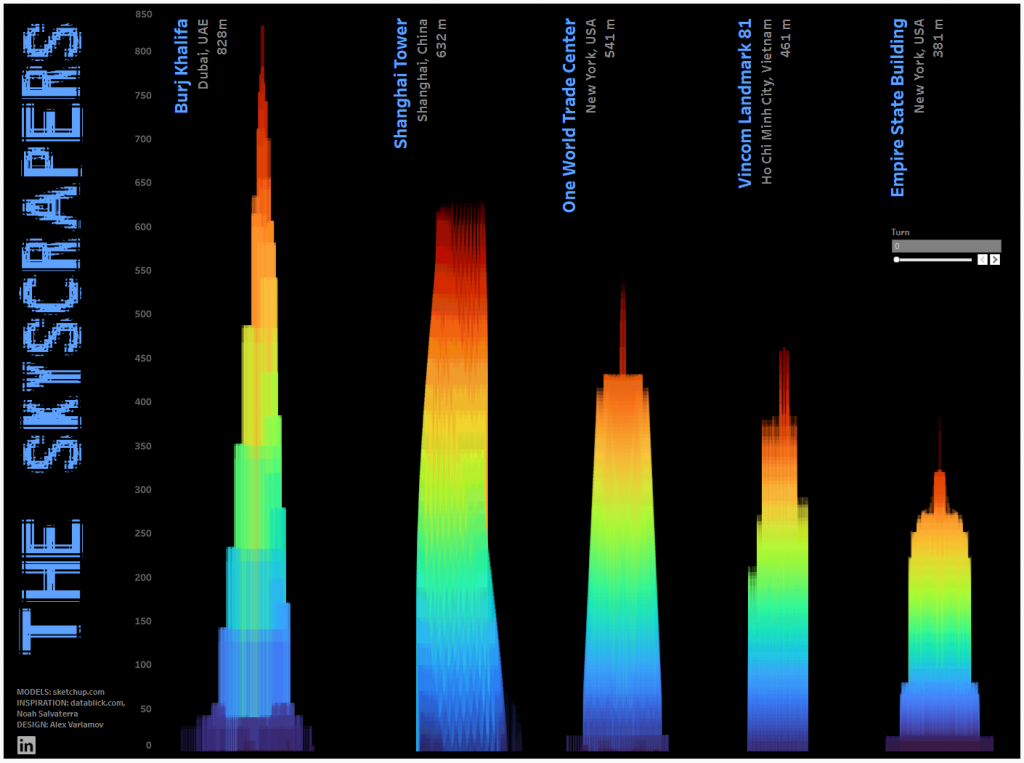
I used the technique in my viz ‘Polygonal Cities’ which you can find here:

We can also experiment with other marks including bars, lines, circles etc. For example, in the following, I used bars:
You can’t really tell it’s a bar chart, but it is!
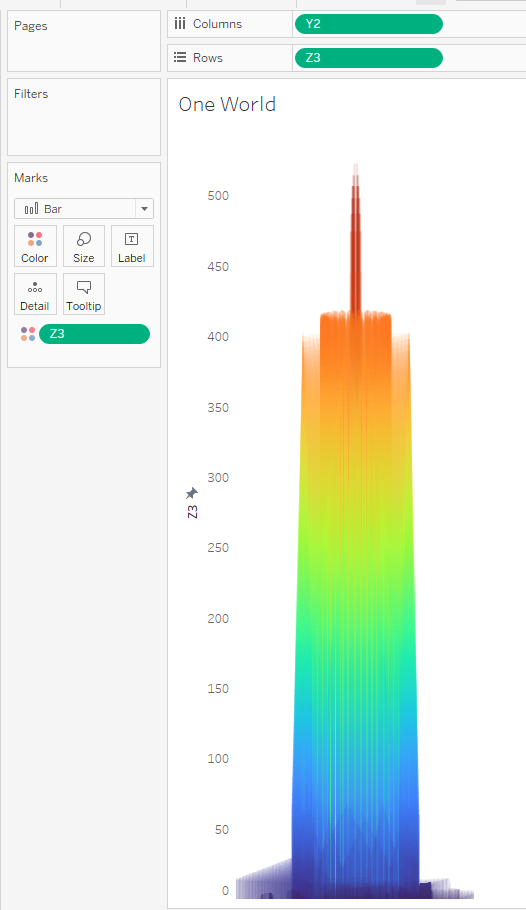
This visualization is an illusion of 3D models in Tableau.
2. Let’s go deeper into other 3D formats
Everything above is based on .STL models. The issue with STL models is that they do not include information about polygons’ colors and they work with only triangles (i.e. each polygon has 3 vertices). But, there are different formats of 3D models including .OBJ, .DAE, .FBX, .KMZ. Many of these work with polygons with more than 3 vertices and contain information about textures and groups of polygons. I’m going to work with the good old .OBJ format (feel free to investigate other types of files if you like.) The reasons I prefer .OBJ format are:
- The format is open
- It is a text format, i.e. you can open it by Notepad (I use Notepad++ on PC and Atom on Mac)
- The format is easier than other formats for understanding and converting to .CSV format (in my opinion).
- A lot of models in .OBJ format are available in the internet for free (free3d.com for example)
To further explore some of the advantages of OBJ files, let’s compare the same 3D model in .STL and .OBJ format created in Tableau (see a picture below).
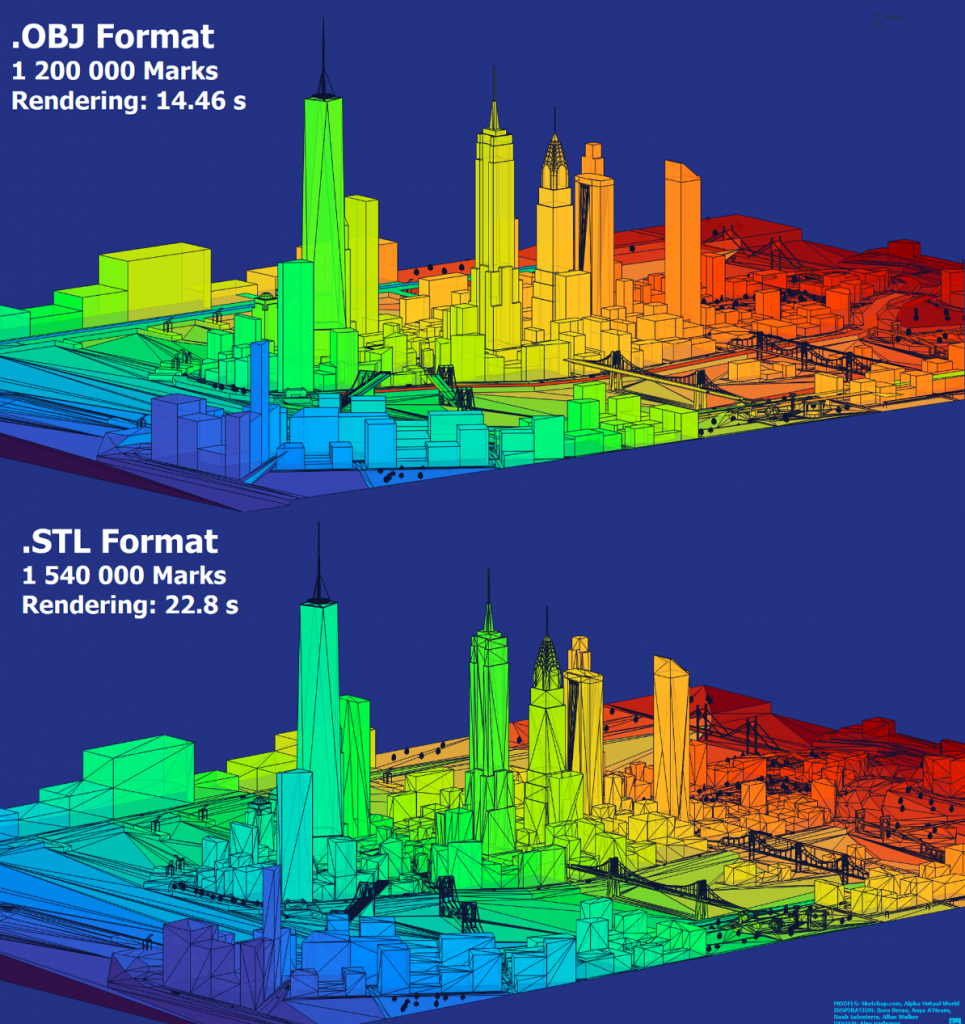
As .STL format works with triangles, the 3D model requires more polygons than the same 3D model in .OBJ format. Hence the .OBJ model has less marks in Tableau and looks better aesthetics. Obviously, due to the lower number of marks, Tableau rendering performance is also better with .OBJ model (You can compare rendering time on the picture above. The rendering time was taken using performance recording in Tableau.) But there is a disadvantage of .OBJ format: in case of complex polygons in .OBJ format more discrepancies may occur due cyclic overlap or piercing polygons.
3. What is the .OBJ format?
Let’s talk a bit more about the OBJ file format. (To know more about the format, see the description).
Here’s a fragment of .OBJ file:
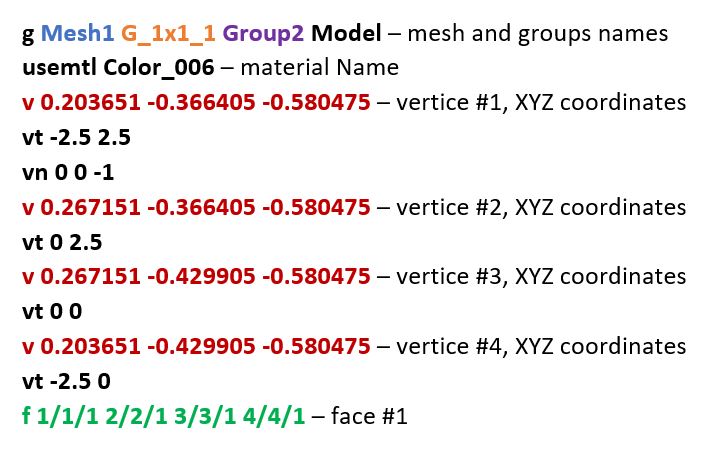
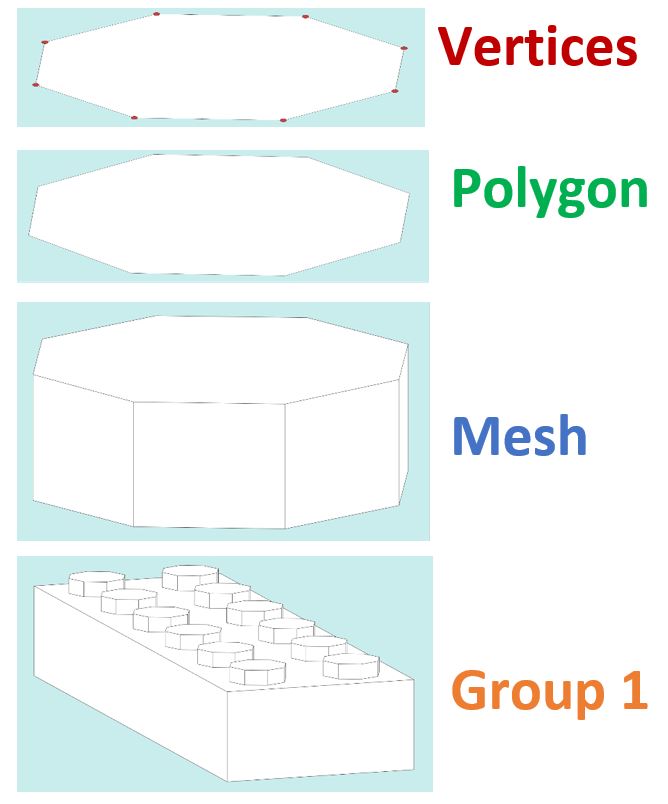
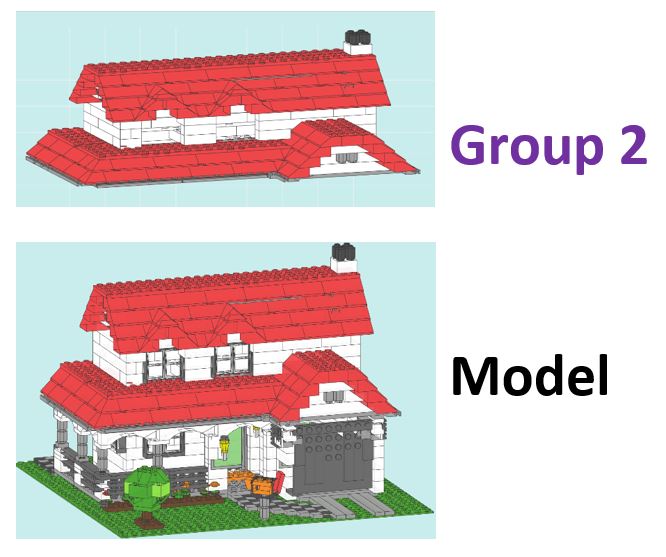
Each Mesh in .OBJ file contains Polygons (Faces). Each Polygon contains a set of vertices. Meshes and groups can join in groups. For better understanding, take a look at a 3D Lego model:
usemtl Color_006 in the code fragment above is a material name, which represents a texture in the 3D model. There are no textures in Tableau, but we can get the data and represent it as a color.
Thus, the .OBJ format looks like a nesting doll with a few levels of geometrics figures. The format also contains other information about edges, normals, lighting etc. We won’t use those in Tableau, so we will filter it.
Note: The full .OBJ specification you can find here
Many models are available in 3D Warehouse and you can download them as a SketchUp file (.SKP). The Desktop version of SketchUP Pro can export .SKP file to .OBJ file. Please note, that SketchUP Pro is not free but you can try it (trial period is 30 days).
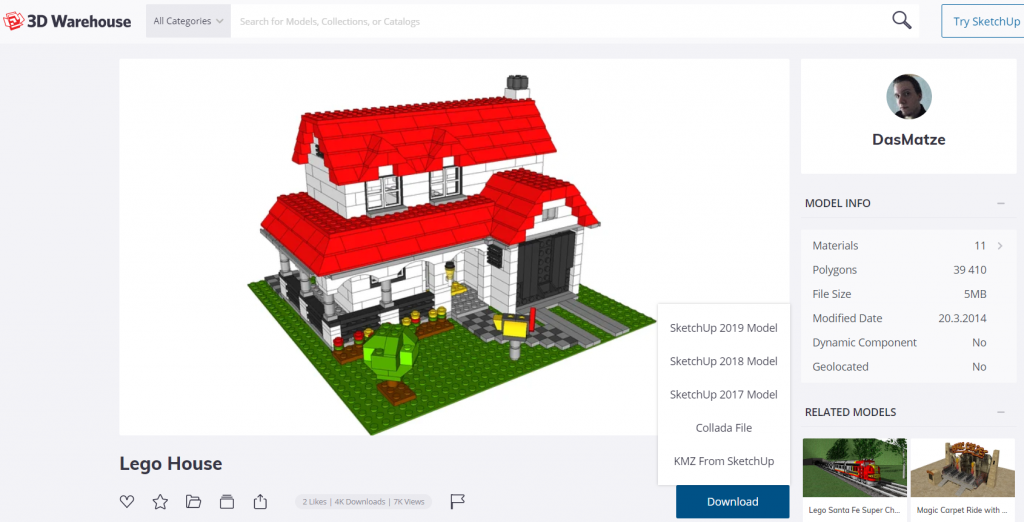
Many other sites also allow you to download OBJ files directly.
Using SketchUP Pro, you can remove all unnecessary polygons. I would recommend to center you model with center in (0,0,0). Then you can export the project as .OBJ file. Having the .OBJ file, we can convert it to data acceptable for Tableau.
4. How to get data from .OBJ format and upload it to Tableau
The .OBJ format is in sequential order, so it does not number the vertices, faces or meshes. Hence we need to numerate each part of it, as we did with the STL file. Like the STL file, I used a python script, but we can use Excel also. The goal will be to create four files:
– v.csv (vertices)
– f.csv (faces)
– g.csv (meshes/groups)
– color.csv (colors)
If you do not need colors and groups (meshes) for your model in Tableau, you can create only v.csv and f.csv.
Faces
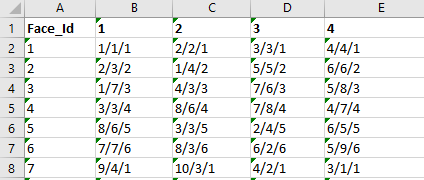
Text file for faces looks like this, where there are columns separated by spaces:
1 f 1/1/1 2/2/1 3/3/1 4/4/1
2 f 2/3/2 1/4/2 5/5/2 6/6/2
3 f 1/7/3 4/3/3 7/6/3 5/8/3
4 f 3/3/4 8/6/4 7/8/4 4/7/4
5 f 8/6/5 3/3/5 2/4/5 6/5/5
6 f 7/7/6 8/3/6 6/2/6 5/9/6
7 f 9/4/1 10/3/1 4/2/1 3/1/1
You can upload your .OBJ file to Excel and make transformation there:
- Delete rows without ‘f’ in first column
- Delete column with ‘f’
- Add a column, numerating rows
- Add field names to the columns
After data transforming you will have this:
Note that you should name the columns 1,2,3… as maximum polygons in a row.
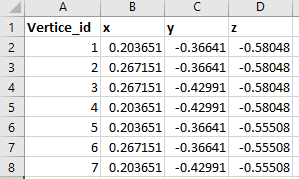
Vertices
Upload your .OBJ file to Excel and make transformation similarly to the faces file. Result should look something like this:
Uploading the data to Tableau
1. Connect to the f.csv (or f.xlsx) file
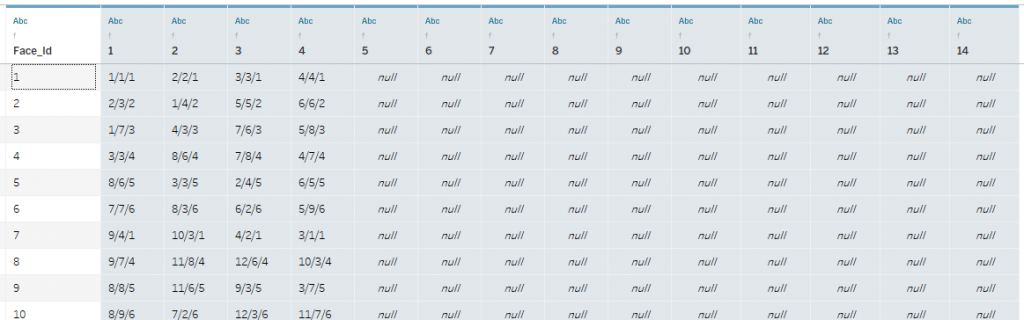
2. Pivot columns from 1 to last 14 (in my case) column:
3. Create inner join with v.txt (or v.xlsx) file using a join clause on the left and Vertice_id on the right:
INT(SPLIT([Pivot Field Values],’/’,1)) and Vertice_id
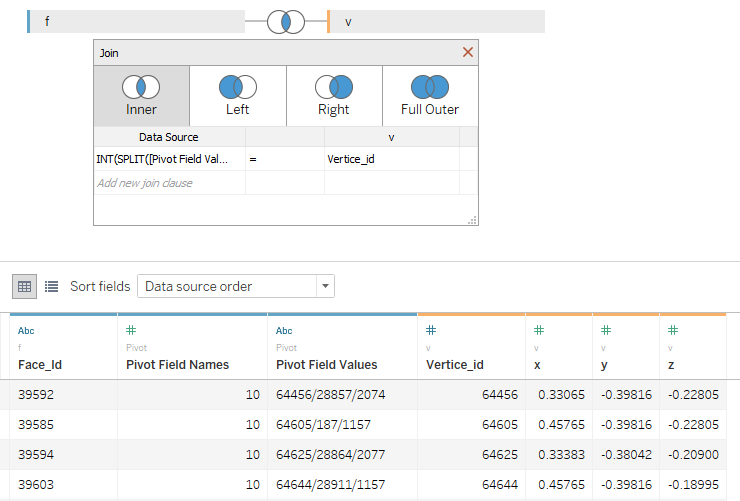
Congratulations! You have all necessary data to make a polygonal model:
- Create the same rotation formulas and parameters as in .STL
- Create a view like shown below, using ‘Pivot Field Names’ as a Path. ‘Pivot Field Names’ here is a number of vertex in a face.
Now you have a monochrome 3D polygon model. You should sort polygons using a painting algorithm as I described in the .STL section.
Color and groups
To address the color and groups, we’re going to leverage some of the new analytical functions of Tableau Prep. In the example below, I’ll use Tableau Prep 2020.1.
We can use RANK and RANK_DENSE functions. Unlike Tableau Desktop, these functions are not really table calculations and they have a different syntax. The functions in Tableau Prep return ranks of values in any column.
My flow does the following:
1. Keeps only rows with prefixes ‘usemtl’ (colour) and ‘f’ (faces)
2. Create a calculation for rank: { ALONG [Row Number Field] ASC : RANK() }
Colors
We’re going to use textures to specify the color. Rows describing textures start with ‘usemtl’ in an .OBJ file. All faces after the ‘usemtl’ string have the same color so we need find all polygons after the ‘usemtl’ row and assign them the same color. This is a bit harder than operations with vertices and faces but it can be done in Excel. As Tableau Prep has the new functions mentioned above, let’s use them.
1. Connect Prep to your your .OBJ file (as txt).
2. Filter out any columns that do not have ‘f’ or ‘usemtl’ in the first column.
3. Add a calculation: { ALONG [Row Number Column] ASC : RANK() } (See a picture below). ‘ASC’ defines an ascending order. This calculation makes a new numeration of rows returning ranks of row number column.
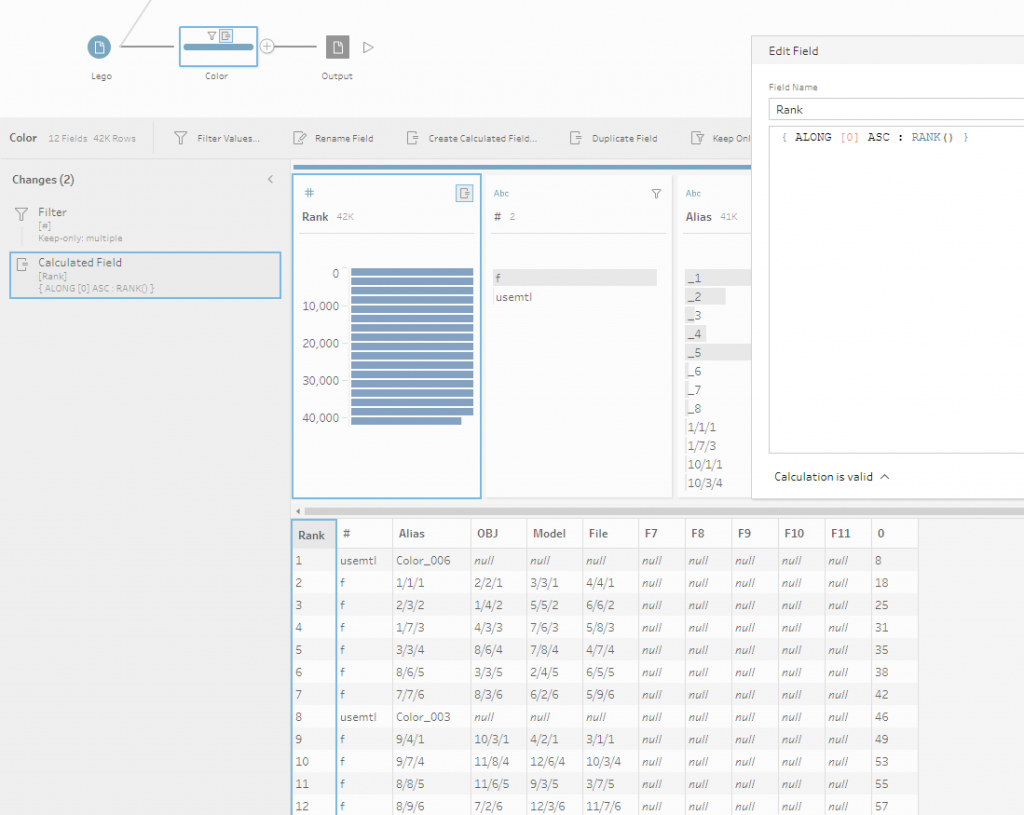
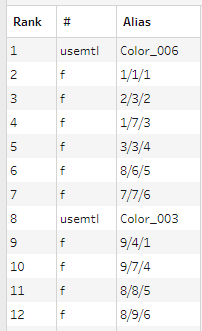
4. Remove unnecessary columns leaving only 3 columns (Rank, #, Alias)
5. Add two columns ‘Face Num Rank’ and ‘Color’ as shown below.
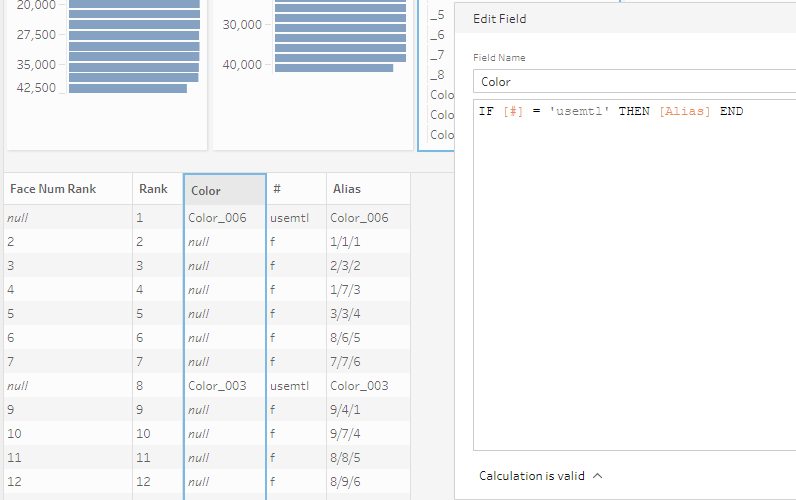
6. Create a calculated field, ‘Face Id Raw’
{ ALONG [Face Num Rank] ASC : RANK_DENSE() }
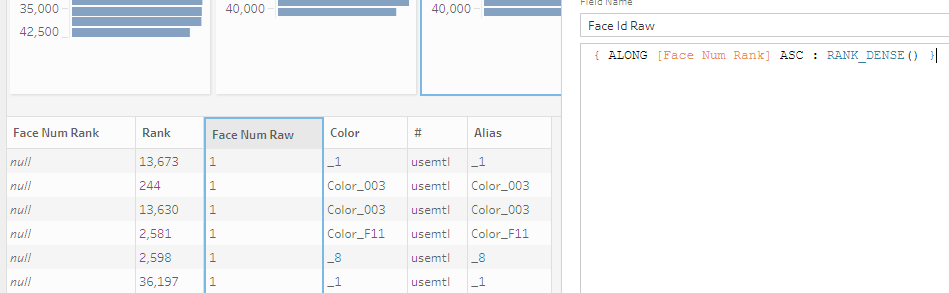
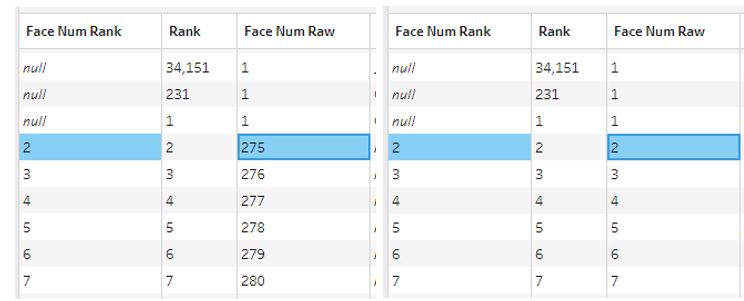
The calculation ‘Face Id Raw’ returns ‘Face_id’+1. We can’t use RANK() here because RANK() assigns 1 to all ‘null’ values and returns 275 in our case, so we use RANK_DENSE here.
Compare the functions below:
RANK() RANK_DENSE()
7. Create a calculated field, ‘Face_id’
[Face Num Raw]-1
8. Keep only 3 fields, Face_Id, Rank, Color

9. Export the data to .csv
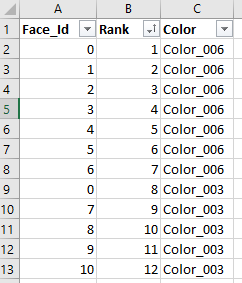
10. Open .csv in Excel. Sort ‘Rank’ column in ascending order:
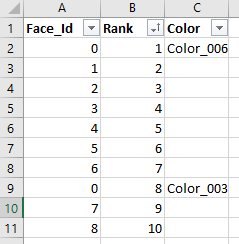
11. Fill empty cells in the ‘Color’ column. Choose the column, press ‘fn+f5’ in Windows, click on ‘Blanks’ in an opened dialogue window and press ‘Ok’. After choosing all empty cells in the column write ‘=C2’ in a function shelf and press ‘Ctrl+Enter’
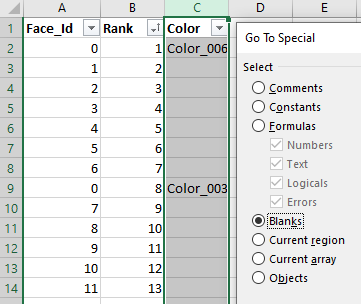
12. You will get a data set:
Save it and upload to your project in Tableau
13. Make an Inner Join
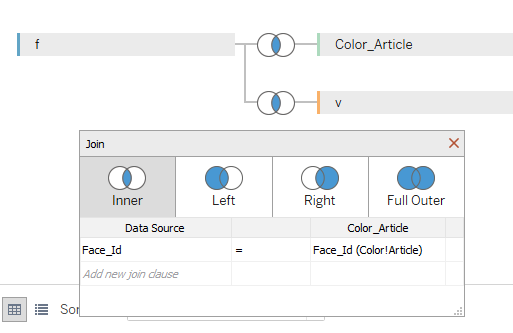
Adding ‘Color’ field to color card will give you this:
Adding Groups
Our groups data set will be prepared similarly to the color data set except you should work with ‘g’ and ‘f’ rows instead of ‘usemtl’ and ‘f’.
Joining previous data sets with Groups in Tableau we will have a ‘Group’ field.
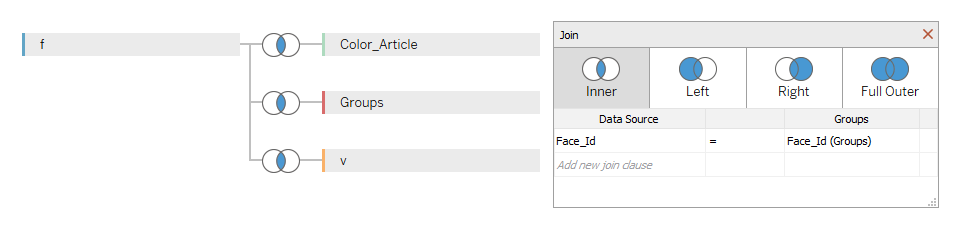
The groups are needed only if you would like to filter some parts of your viz. An example might be filtering the Lego bricks in order to emulate each step of assembly.
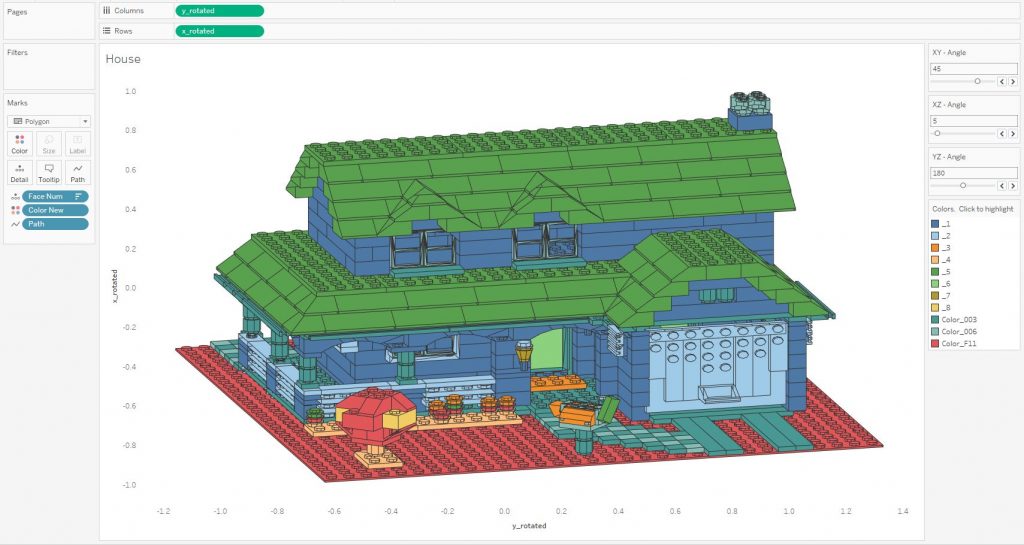
And the final viz:
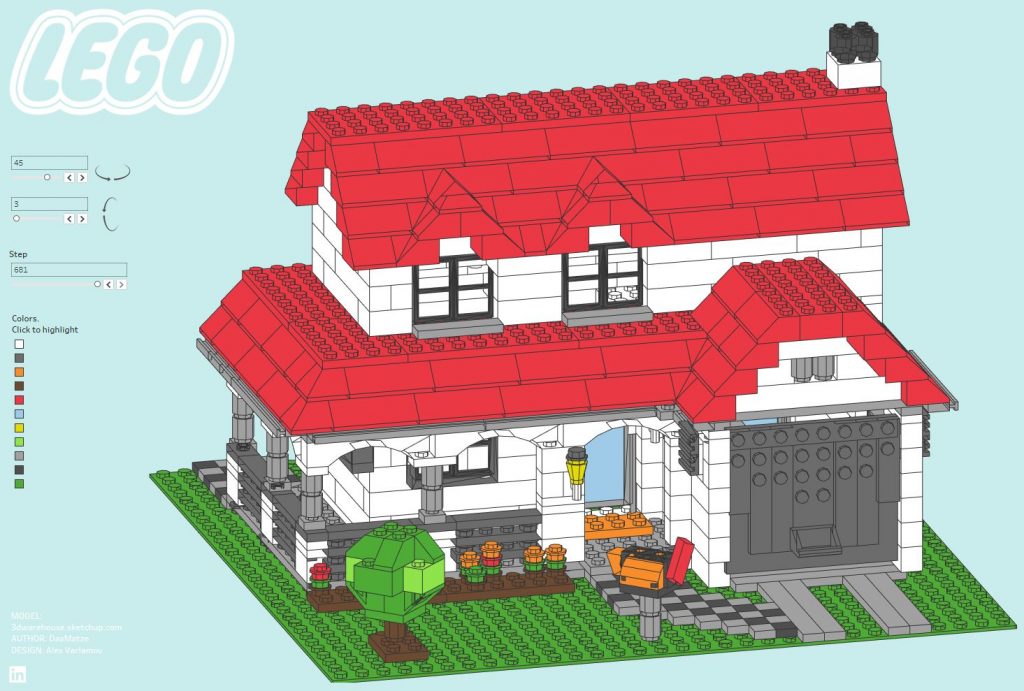
There is a video showing assembling the house step by step:
Note: I’ve written an article ‘Creating video with Tableau and software robots‘ that describes such video creating process
See also other .OBJ 3D models in Tableau: A Helicopter and A Ship made with lines.
5. A Polygon Order Problem
We’ll need to tell Tableau how to draw the polygons in order to ensure that polygons in the front are actually brought to the front (this is called the Z-Order). To do this, we need to create a calculation. A simple approach would be to to use z_rotation calculation described above in .STL models. But, the rotation can cause some problems with this approach, leading to overlapped polygons. For example, see below. We can see wood beams above the roof but it should be below the roof.
‘Z_axis’ polygon sorting

Custom calculation for polygon sorting

To address this problem I used a calculated field to bring the roof closer to avoid the effect:
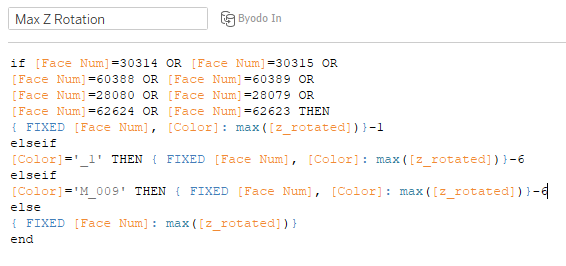
[Color] =‘_1’ – is a roof color here. Also there are some other polygons and groups were brought closer or further to minimize the problem.
I couldn’t find a universal sorting method, so I had to use the workaround above. If you create your own model, please be aware that you may run into similar issues.
Full viz:

Conclusion
3D Models are not a common way of using Tableau, but they can be a great way to explore Tableau’s capabilities and deepen your knowledge of the platform. I believe we will continue to see people discovering new ways to create 3D models and I hope this blog encourages members of Tableau community to create 3D vizzes. Personally I’m thinking about how I might create a 3D basketball court with ball’s trajectories, etc. I think it’s possible with Tableau!