The blog post describes how to create transparent bar charts using the Transparent Sheets feature.

The blog post describes how to create transparent bar charts using the Transparent Sheets feature.
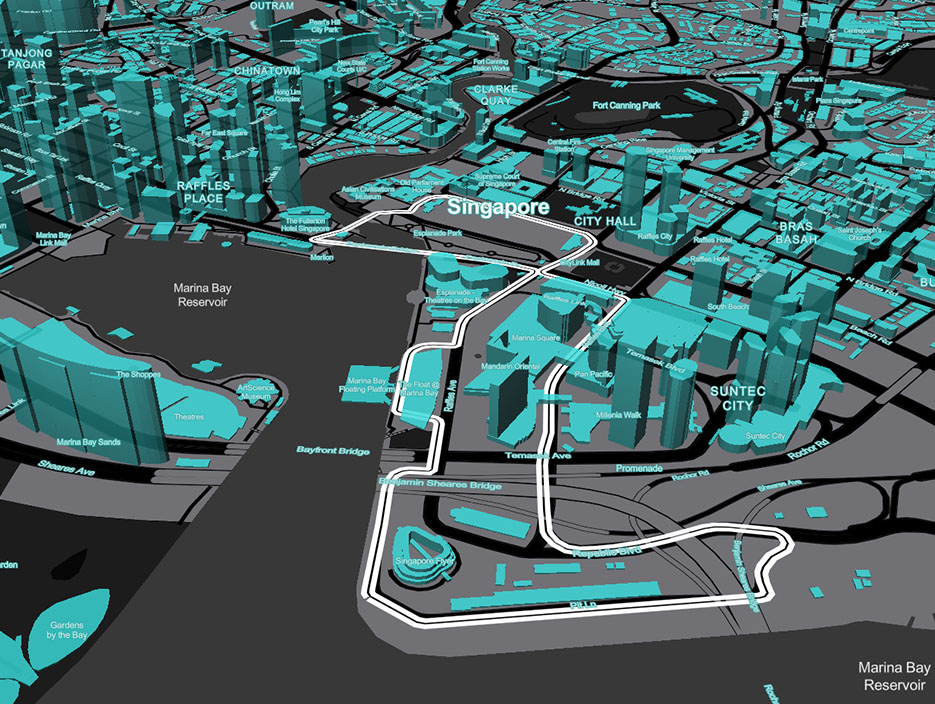
The Mapbox tools are amazing things that can empower spacious data analysis and visual analytics. Tableau and PowerBI are efficient analytics software for complex analytics challenges and astounding data visualizations. Connecting monsters in geomapping and BI we can create powerful tools for the spacious analysis.